Table of Contents
- 1 What is Ratio?
- 2 What is Ratio Analysis?
- 3 Introduction of Ratio Analysis
- 4 Different Approach to Ratio Analysis
- 5 Importance of Ratio Analysis
- 6 Types of Ratios
- 7 Analysis of Liquidity
- 8 Analysis of Turnover Ratio
- 9 Analysis of Profitability
- 10 Analysis of Capital Structure Ratio Formula
- 11 Limitations of Ratio Analysis
- 12 Precautions in Using Ratios
What is Ratio?
The term “Ratio” simply means one number expressed in terms of another. It describes in mathematical terms the quantitative relationship that exists between two numbers. The term “Accounting Ratio” is used to describe the significant relationship between figures shown on a Balance Sheet, in a Profit and Loss Account.
What is Ratio Analysis?
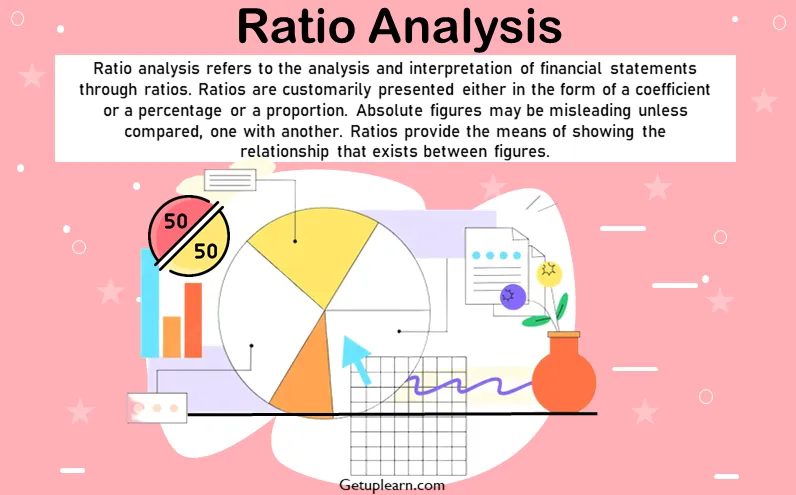
Ratio analysis refers to the analysis and interpretation of financial statements through ratios. Ratios are customarily presented either in the form of a coefficient or a percentage or a proportion. Absolute figures may be misleading unless compared, one with another. Ratios provide the means of showing the relationship that exists between figures.
However, the numerical relationships of the kind expressed by ratio analysis are not an end in them but are a means for understanding the financial position of a business. Ratios, by themselves, are meaningless, simple ratios compiled from a single year’s financial statements of an enterprise may not serve the real purpose.
Besides, in order to reach valid conclusions, ratios are to be worked out from the financial statement of a number of years and have to be compared with some standards that are established after a systematic review of past experiences.
A single ideal standard cannot be applied to all types of business. Each business has its own limitations; hence ideal ratio will differ between industries and also differ with size, capital, and other factors.
Introduction of Ratio Analysis
A basic limitation of the traditional financial statement comprising the balance sheet and the profit and loss account provides a summarised view of the financial position and operations of a firm. Different parties are interested in the financial statement for different purposes and look at them from different angles.
For example, the debenture holders analyze the statements in order to ascertain the ability to pay interest and maturity amounts. The prospective shareholders would like to know whether the business is profitable and is progressing on sound lines. The management is interested in the operational efficiency as well as the financial position of the business.
Hence, the main objective of financial analysis is to make a detailed study of the cause and effect of the profitability and financial condition of the firm. Hence, ratio analysis is a tool to predict the operational as well as financial efficiency of a business through the analysis & interpretation of financial data.
So the analysis of financial statements is a process of selection, relation, and evaluation. The first task of the financial analyst is to select the information relevant to the decision under consideration. The second step is to arrange the information in a way to highlight significant relationships.
The final step is the interpretation and drawing of inferences and conclusions. The present chapter involves an in-depth analysis of financial statements and their use for decisions making by various parties interested in them.
Different Approach to Ratio Analysis
Generally, there are four different approaches to ratio analysis available:
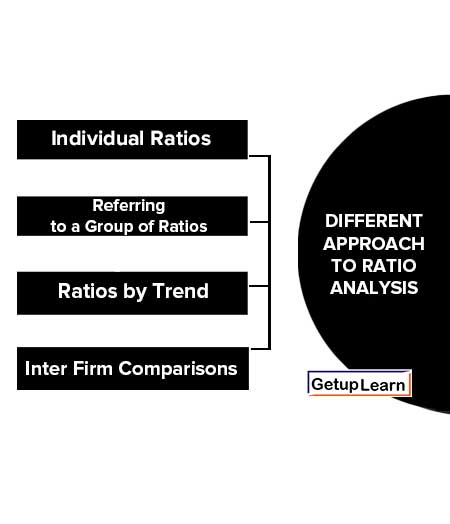
Individual Ratios
Interpretation of Individual Ratios: A single ratio fails to reveal the true position. If it relates to preceding years or compared with the same type of other business or studied with reference to some standards, may be useful. Hence this approach is to be combined with others.
Referring to a Group of Ratios
Interpretation by Referring to a Group of Ratios: The analysis could be made more meaningful by computing some of the additional related ratios. A Change in one ratio may have significance only when viewed in relation to other ratios.
Ratios by Trend
Interpretation of Ratios by Trend: It involves a comparison of ratios of a firm over time. The trend ratios indicate the direction of change over the years.
Inter Firm Comparisons
Interpretation by Inter-firm Comparisons: It involves the comparison of the ratios of a firm with those of others in the same line of business or for the industry as a whole reflecting its performance in relation to its competitors.
Importance of Ratio Analysis
These are the importance of ratio analysis:
- It is an invaluable aid to management for planning, forecasting, control, and decision-making.
- Ratios enable the mass of accounting data to be summarized and simplified.
- It facilitates better coordination and control of performance as well as control of costs.
- It is a tool to assess important characteristics of a business like liquidity, solvency, profitability, etc.
- It is an effective tool of analysis for intra-firm and inter-firm comparisons.
- It enables a firm to take time dimension into account by using trend analysis of ratios.
- It enables the easy understandability of accounting figures, for those who do not know the language of accounting.
- It is an effective means of communication with the owners and other parties interested therein.
Types of Ratios
Ratios may be classified in a number of ways to suit any particular purpose. Different kinds of ratios are selected for different types of situations. In general, the following bases of classification are in vogue.
The following is the classification of ratios:
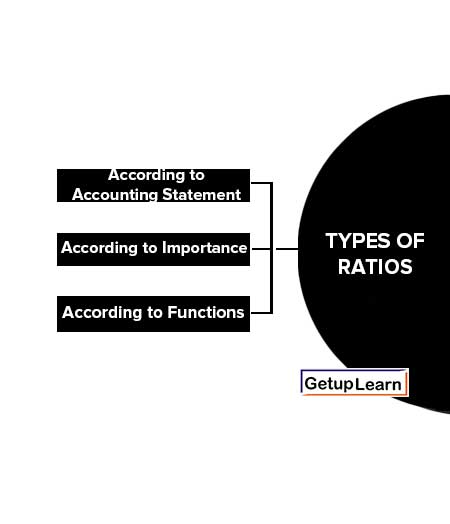
According to Accounting Statement
Classification According to Accounting Statement: This classification is based on the nature of accounting statements such as Balance sheet ratios. Profit and loss Account Ratios, combined ratios, etc.
According to Importance
Classification According to Importance: It’s like primary ratios and secondary ratios. Some of the ratios are termed as primary and others are termed as subsidiary or supporting ratios.
According to Functions
Classification According to Functions: ratios are grouped as liquidity, Activity, Profitability, long-term solvency, and Market analysis ratios.
From the above discussion, it may be observed that one basis of classification blends with another. We are taking classification according to functions for description.
Analysis of Liquidity
Liquidity refers to the ability of a firm to meet its short-term financial obligations when and as they fall due. The main concern of the liquidity ratio is to measure the ability of the firms to meet their short-term maturing obligations.
The greater the coverage of liquid assets to short-term liabilities the better as it is a clear signal that a company can pay its debts that are coming due in the near future and still fund its ongoing operations.
On the other hand, a company with a low coverage rate should raise a red flag for investors as it may be a sign that the company will have difficulty meeting running its operations, as well as meeting its obligations.
The following are liquidity ratios:
- Current Ratio
- Liquidity Ratio, Quick Ratio, or Acid-Test Ratio
- Super Quick Ratio or Absolute Liquidity Ratio
Current Ratio
The number of times that the short-term assets can cover the short-term debts. In other words, it indicates an ability to meet short-term obligations as & when they fall due. It may be defined as the ratio of current assets to current liabilities. It is expressed as:
Current Ratio Formula
| Current Ratio= | Current Assets —————————— Current Liabilities |
Current assets normally include cash in hand and at the bank, marketable securities, bills receivable, Book debts excluding provision, inventories, and prepaid expenses, current liabilities include items such as outstanding expenses, sundry creditors, bills payable, bank overdraft, provision for taxation, proposed dividend, income tax payable, unclaimed dividend, etc.
Current asset means cash or those assets convertible or expected to be converted into cash within the accounting year and current liabilities are those liabilities to be paid within the same time.
Interpretation: It specifies that how much current assets are available to meet current liabilities. Hence these ratios depict the payment capacity of the concern. Thus, it is a measure of the margin of safety for creditors. The higher the ratio, the better it is, however, too high a ratio reflects an inefficient use of resources & too low a ratio leads to insolvency. The ideal ratio is considered to be 2:1.
Liquidity Ratio, Quick Ratio, or Acid-Test Ratio
It indicates the ability to meet short-term payments using the most liquid assets. This ratio is more conservative than the current ratio because it excludes inventory and other current assets, which are more difficult to turn into cash. It is a measure of the liquidity of a firm, how speedy it is able to repay its current liabilities.
Current Ratio Formula
| Current Ratio or Liquidity Ratio= | Current Assets —————————— Current Liabilities |
Quick assets include all current assets excluding inventories, prepaid expenses, advance tax, and advance payments, current liabilities mean as defined in the current ratio. It is a more rigorous test of liquidity than the current ratio and, used together with the current ratio, it gives a better picture of the short-term financial position of the firm.
Interpretation: The ideal ratio is 1:1. Another beneficial use is to compare the quick ratio with the current ratio. If the current ratio is significantly higher, it is a clear indication that the company’s current assets are dependent on inventory.
Super Quick Ratio or Absolute Liquidity Ratio
This ratio is calculated to assess the quick ability to pay liquid liabilities. It is the ratio between absolute liquid assets and liquid liabilities:
Super Quick Ratio Formula
| Super Quick Ratio= | Cash in hand, Cash at Bank, and Marketable Securities —————————— Current Liabilities−Bank Overdraft |
This ratio is the most rigorous and conservative test of a firm’s liquidity position.
EXAMPLE-1: Calculate liquid ratio, current ratio, and super quick ratio from the following data:
|
Current Assets= Stock= Prepaid Expenses= Working Capital= Bank Overdraft= Cash balance= Marketable securities= |
Rs. 50000 Rs. 10000 Rs. 5000 Rs. 30000 Rs. 5000 Rs. 10000 Rs. 5000 |
| Current Ratio= | Current Assets 50,000 —————————— = —————– = 2.5:1 Current Liabilities 20,000 |
| Liquidity Ratio= | Current Assets 35,000 —————————— = —————– = 1.75:1 Current Liabilities 20,000 |
| Super Quick Ratio= | Cash in hand, Cash at Bank, and Marketable Securities 15,000 ———————————————————————————————————— = —————– =1:1 Current Liabilities−Bank Overdraft 15,000 |
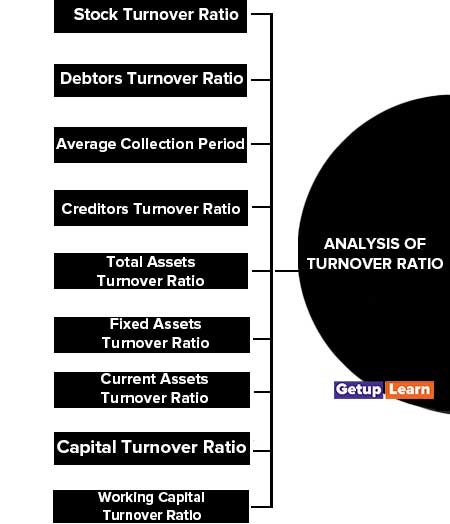
Analysis of Turnover Ratio
Firms invest its fund into various assets if utilizations of assets are effective it reflect the sales. Hence, whether the funds are effectively utilized, can be determined by calculating the turnover ratio. The activity of utilization of funds or efficiency can be calculated by the following ratios:
- Stock Turnover Ratio
- Debtors Turnover Ratio
- Average Collection Period
- Creditors Turnover Ratio
- Total Assets Turnover Ratio
- Fixed Assets Turnover Ratio
- Current Assets Turnover Ratio
- Capital Turnover Ratio
- Working Capital Turnover Ratio
Stock Turnover Ratio
It measures the stock in relation to turnover in order to determine how often the stock turns over in the business. It indicates the efficiency of the firm in selling its product. It is computed by dividing the cost of goods sold by the average inventory.
| Stock Turnover Ratio= | Cost of Goods Sold ————————————- Average Stock |
Cost of Goods Sold: Opening Stock + Purchases + Direct Expenses – Closing Stock(or) Cost of Production + Opening Stock of Finished Goods – Closing Stock of Finished Goods(or) Sales – Gross Profit.
| Average Stock= | Opening Stock+Closing Stock ————————————- 2 |
Interpretation: The ratio indicates how fast inventory is sold. A high ratio is good from the viewpoint of liquidity and vice versa. A low stock turnover ratio signifies that excessive investment in stock, the slow-moving stock is higher and the market is in a slack position. Whereas, a higher turnover ratio specifies that the firm is able to earn higher profit at a lower profit margin.
| Stock Velocity= | No.of days or Months in a year ————————————- Stock Turnover Ratio |
Debtors Turnover Ratio
It is determined by dividing the net credit sales by average debtors, thus:
| Debtors Turnover Ratio= | Net Credit Sales ————————————- Debtors+Bills Receivable |
Net credit sales = Credit Sales – Sales Return
| Average Stock= |
Opening Debtors & ???????????????????? ????????????????????????????????????????????+???????????????????????????? ???????????????????????????? & ???????????????????? ???????????????????????????????????????????? ————————————- 2 |
The ratio measures how rapidly receivables are collected. A high ratio is indicative of a shorter time lag between credit sales and cash collection. A low ratio shows that debts are not being collected rapidly.
Average Collection Period
The average collection period measures the quality of debtors since it indicates the speed of their collection. This ratio specifies that in how many days collection is made from debtors.
Average Collection Period Formula
| Average Collection Period= | Debtors+Bills Receivable —————————————————x No of Months or Days in a Year Net Credit Sales |
Interpretation: The shorter the average collection period, the better the quality of debtors, as a short collection period implies prompt payment by debtors. An excessively long collection period implies a very liberal and inefficient credit and collection performance.
The delay in the collection of cash impairs the firm’s liquidity. On the other hand, too low a collection period is not necessarily favorable, rather it may indicate a very restrictive credit and collection policy which may curtail sales and hence adversely affect profit.
Creditors Turnover Ratio
| Creditors Payment Period= | Average Payables —————————————————x No of months/Days in a year Net Credit Purchases |
This ratio shows that in how much the day’s amount is paid to suppliers.
Total Assets Turnover Ratio
This ratio indicates the efficiency with which the firm uses all its assets to generate sales.
| Total Assets Turnover Ratio= | Cost of Goods Sold —————————————– Total Assets |
Total Assets = Net fixed Assets + Current Assets + Intangible Assets (if there is any realizable value) but excluding fictitious assets.
Interpretation: Higher the firm’s total asset turnover, the more efficiently its assets have been utilised.
Fixed Assets Turnover Ratio
This ratio is a rough measure of the productivity of a company’s fixed assets with respect to generating sales.
Fixed Assets Turnover Ratio Formula
| Fixed Assets Turnover Ratio= | Cost of Goods Sold —————————————– Net Fixed Assets |
Interpretation: This ratio specifies the efficiency and profit-earning capacity of the firm. High fixed asset turnovers are preferred since they indicate better efficiency in fixed asset utilization.
Current Assets Turnover Ratio
Current Assets Turnover Ratio Formula
| Current Assets Turnover Ratio= | Cost of Goods Sold —————————————– Current Assets |
It reflects the efficiency & capacity of working capital.
Capital Turnover Ratio
Capital Turnover Ratio Formula
| Capital Turnover Ratio= | Cost of Goods Sold —————————————– Capital Employed |
Capital Employed = Fixed Assets + Current Assets – Current Liabilities (excluding fictitious assets and non-trading assets)
The efficiency and effectiveness of business operations are judged by this ratio. It is a better measurement of the use of capital employed.
Working Capital Turnover Ratio
Working Capital Turnover Ratio Formula
| Working Capital Turnover Ratio= | Cost of Goods Sold —————————————– Net Working Capital |
It is used to assess the efficient use of working capital in making sales. A high ratio indicates over trading and a low ratio indicates under trading.
Note: In the above ratios always cost of goods sold is taken but if it is not available then “sales” may be used. If the opening balance is not given then only the closing balance will be taken for calculation. In the absence of specific information, all sales/purchases are treated as credit, purchase returns and sales returns are also treated as returns from credit.)
Analysis of Profitability
Profitability is the ability of a business to earn profit over a period of time. The profitability ratios show the combined effects of liquidity, asset management (activity), and debt management (gearing) on operating results.
The overall measure of success of a business is the profitability that results from the effective use of its resources. Profitability depends on the quantum of sales and use of financial resources. It can be calculated on these two bases:
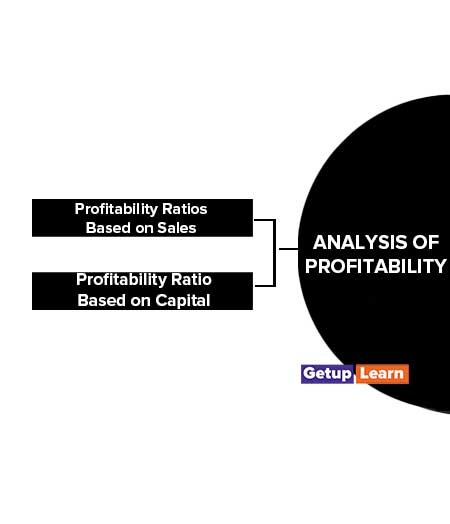
Profitability Ratios Based on Sales
These are the types of profitability ratios based on sales:
Gross Profit Ratio
A company’s cost of goods sold represents the expense related to labor, raw materials, and manufacturing overhead involved in its production process. This expense is deducted from the company’s net sales/revenue, which results in a company’s gross profit.
The gross profit margin is used to analyze how efficiently a company is using its raw materials, labor, and manufacturing-related fixed assets to generate profits.
Gross Profit Ratio Formula
| Gross Profit Ratio= | Gross Profit ————————–X 100 Net Sales |
Interpretation: The higher the ratio, the greater will be the margin, and the lower the ratio the profit is declining in comparison to sales. It means the higher the ratio, the higher the profit earned on sales.
Operating Ratio
By subtracting selling, general and administrative expenses from a company’s gross profit number, we get operating income. Management has much more control over operating expenses than its cost of sales outlays. It Measures the relative impact of operating expenses.
| Operating Ratio= | Operating Profit ———————————-X 100 Net Sales |
Operating Costs
Operating Costs= Cost of goods sold + operating expenses It indicates the operational efficiency and profit earning capacity of the firm.
Expenses Ratios
| Material consumed Ratio= | Material Consumed ——————————————X 100 Net Sales |
Finance Expenses Ratio Formula
| Finance Expenses Ratio= | Operating Profit ———————————-X 100 Net Sales |
Selling Expenses Ratio
| Manufacturing/Administration/Selling expenses Ratio= | Manufacturing/Administration/Selling Expenses ————————————————————————–X 100 Net Sales |
It reveals managerial efficiency by comparing these ratios over a period of time.
Net Profit Ratio
| Net Profit Ratio= | Net Profit (After Tax or Before Tax) ————————————————————————X 100 Net Sales |
It reveals the overall profitability and efficiency of the business. A high ratio means an adequate return to the owners’ and firms’ capacity to stand in a competitive market. If the ratio is calculated on before-tax profit measures the managerial efficiency and if it is calculated by taking after tax then it is used for comparing two firms or for the owner’s purpose.
Interpretation: Higher the ratio, the more profitable the sales.
Profitability Ratio Based on Capital
The efficiency of enterprises can be judged by capital employed also because sometimes conclusions drawn on the basis of net profit to sales may be misleading. Such important ratios are:
- Return on capital Employed
- Return on Net Worth
- Return on Equity Shareholders Funds
- Return on Total Assets
Return on capital Employed
Return on capital Employed (ROCE) (Return on Investment): This ratio complements the return on equity ratio by adding a company’s debt liabilities, or funded debt, to equity to reflect a company’s total “capital employed”. This measure narrows the focus to gain a better understanding of a company’s ability to generate returns from its available capital base.
| ROCE Ratio= | Net Profit Before Tax —————————————— X 100 Capital Employed |
Or Assets Turnover x Profit Margin
| Sale Net Profit ————————— X————————–X100 Total Assets Sales |
Capital Employed Means: Gross Capital Employed = Fixed and current Assets (excluding fictitious Assets and intangible assets if it has no realizable value)
Net Capital Employed = Total Assets (excluding fictitious assets and intangible assets which have no value)- current liabilities.
Average Capital Employed = Opening and Closing Capital employed/2
(or) Capital Employed at the end – 1/2 of the Current year’s profit It is the barometer of the overall performance of the enterprise. It is a measure of the earning power of the net assets of the business. It is beneficial for inter-firm and intra-firm comparisons.
Interpretation: It is a more comprehensive profitability indicator because it gauges management’s ability to generate earnings from a company’s total pool of capital.
Return on Net Worth
| Return on Net Worth= | Net Profit After Tax & ???????????????????????????????? —————————————————————–X 100 Net Worth |
Net worth or shareholders fund or owners’ equity or Proprietors funds =E. S Capital + P.S. Capital + Securities Premium + reserves and surplus (after adjusting fictitious assets and losses).
This ratio reveals the number of earnings for each rupee that the shareholders have invested in the company. It is useful for inter-firm and intra-firm comparisons.
Return on Equity Shareholders Funds
Return on Equity Shareholders
| Funds= | Net Profit After Tax−Preference Dividend ————————————————————————————-X 100 Equity Shareholders Funds |
The ratio provides an adequate test to evaluate whether a company has earned satisfactory returns for its equity holders or not. Investors can compare the normal rate of return in the market with this rate to reach on investment decision.
Return on Total Assets
| Return on Total Assets= | Net Profit After Tax ——————————————————————————-X 100 Total Assets Excluding Fictitious Assets |
Analysis of Capital Structure Ratio Formula
These ratios are called leverage or capital structure or debt management ratios. This is the analysis of capital structure ratio formula:
- Debt Equity Ratio
- Proprietary Ratio
- Solvency Ratio
- Fixed Assets Ratio
- Capital Gearing Ratio
- Interest Coverage Ratio or Service Ratio
Debt Equity Ratio
This ratio measures how much suppliers, lenders, creditors, and obligators have committed to the company versus what the shareholders have committed. This ratio indicates the extent to which debt is covered by shareholders’ funds.
Debt Equity Ratio Formula
| Debt Equity Ratio= | External Equities or Total Debts —————————————————————————————– Internal equities or Net worth of Total Equity |
External Equities = Short Terms and Long-Term Loans
Internal Equities = Shareholders Funds
Interpretation: A lower ratio is always safer, however too low a ratio reflects an inefficient use of equity. A too-high ratio reflects either there is a debt to a great extent or the equity base is too small. This ratio should be balanced.
Proprietary Ratio
The proprietary ratio (also known as the equity ratio) is the proportion of shareholders’ equity to total assets, and as such provides a rough estimate of the amount of capitalization currently used to support a business. It reveals the general financial strength of the business.
Proprietary Ratio Formula
|
Proprietary Funds Proprietary Ratio= ————————————-= Total Assets |
Ordinary Shareholder’s Interest =—————————————————————————————– Total Assets |
Interpretation: A high equity ratio reflects a strong financial structure of the company. A relatively low equity ratio reflects a more speculative situation because of the effect of high leverage and the greater possibility of financial difficulty arising from the excessive debt burden.
Solvency Ratio
The solvency ratio is one of the various ratios used to measure the ability of a company to meet its long-term debts. Moreover, the solvency ratio quantifies the size of a company’s after-tax income, not counting non-cash depreciation expenses, as contrasted to the total debt obligations of the firm.
Solvency Ratio Formula
| Solvency Ratio= | Total Debt —————————————————————————————– Total Assets Excluding Fictitious Assets |
Interpretation: If total assets are more than external liabilities, the firm is treated as solvent.
Fixed Assets Ratio
Fixed-asset turnover is the ratio of sales (on the profit and loss account) to the value of fixed assets (on the balance sheet). It indicates how well the business is using its fixed assets to generate sales.
Fixed Assets Ratio Formula
| Fixed Assets Ratio= | Net Fixed Assets —————————————————————————————– Capital Employed |
Interpretation: It indicates whether there is a proper adjustment between long-term funds and fixed use of capital. A declining ratio may indicate that the business is over-invested in plant, equipment, or other fixed assets
Capital Gearing Ratio
The capital gearing ratio is a useful tool to analyze the capital structure of a company and is computed by dividing the common stockholders’ equity by fixed interest or dividend-bearing funds.
Capital Gearing Ratio Formula
| Capital Gearing Ratio= | Variable Cost Bearing Capital —————————————————————————————– Fixed Cost Bearing Capital |
Variable Cost Bearing Capital = Equity Holders Funds
Fixed Cost Bearing Capital = Debentures + Long Term Loans+preference Shares
Interpretation: A higher ratio reveals that lesser fixed financial charges thus more surpluses available to shareholders.Whereas, a lower ratio indicates the burden of financial charges and it is a situation of high gearing.
Interest Coverage Ratio or Service Ratio
The interest coverage ratio is used to determine how easily a company can pay its interest expenses on outstanding debt. The ratio is calculated by dividing a company’s earnings before interest and taxes (EBIT) by the company’s interest expenses for the same period.
Interest Coverage Ratio Formula
| Interest Coverage Ratio= | Net Profit Before Interest and Tax —————————————————————————————– Fixed Interest Charge |
Interpretation: It is very significant for loan providers. A high ratio indicates the sufficient interest-paying capacity of the firm to the long-term loan providers. The low ratio indicates that the firm is using excessive debt. This ratio, investors can forecast the financial risk by comparing this ratio with the standard ratio of the same business.
Limitations of Ratio Analysis
Ratio analysis is a widely used tool of financial analysis. These are the limitations of ratio analysis explained below:
- There are no ideal standards for comparison.
- Ratios are calculated on the basis of financial statements, but financial statements themselves suffer from a number of limitations. Hence ratio analysis may fail to serve its purpose.
- Impact of inflation reflects misleading results because ratios are calculated on the basis of historical data. Hence inflationary conditions are ignored.
- Ratios are based on historical data and it is used for future prediction. Hence, the forecast for the future may be wrong.
- The ratio is just an aid and cannot replace thinking and personal judgment employed in the decision-making process.
- There are no standard formulae for working out ratios and it makes comparison very difficult.
- Ratios are tools of quantitative analysis only and normal qualitative factors that may generally influence conclusions derived are ignored while computing ratios.
- The ratio alone is not adequate. It will be useful when it is used in a group of ratios or compared over a period of time.
The reliability and significance attached to ratios will largely depend upon the quality of data on which they are based. They are as good as the data itself.
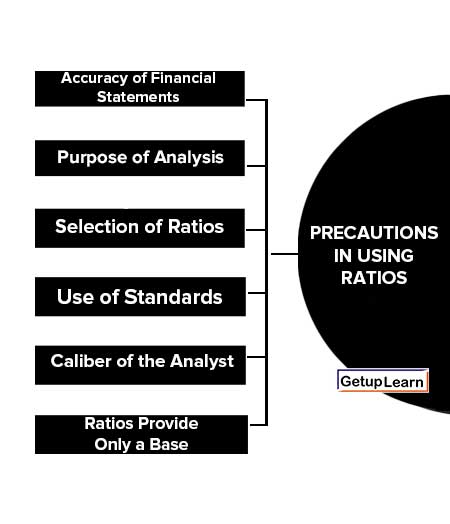
Precautions in Using Ratios
A ratio analysis compares a company’s financial data for the purpose of identifying a current profit trend or providing context to make a business decision.
An accountant or financial analyst preparing this type of document takes several precautions, including ensuring financial data accuracy, before attempting to create a ratio analysis. Failing to take proper precautions can result in inaccurate data and a useless analysis.
- Accuracy of Financial Statements
- Purpose of Analysis
- Selection of Ratios
- Use of Standards
- Caliber of the Analyst
- Ratios Provide Only a Base
Accuracy of Financial Statements
The reliability of ratios is linked to the accuracy of the information in these statements. Before calculating ratios one should see whether proper concepts and conventions have been used for preparing financial statements or not. The precautions will establish the reliability of data given in financial statements.
Purpose of Analysis
A creditor, a banker, an investor, and a shareholder, all have different objectives for studying ratios. The purpose or object for which ratios are required to be studied should always be kept in mind for studying various ratios.
Selection of Ratios
Another precaution in ratio analysis is the proper selection of appropriate ratios. The ratios should match the purpose for which these are required.
Use of Standards
These standards may be a rule of thumb as in the case of the current ratio (2:1) and acid-test ratio (1: 1), maybe industry standards, may be budgeted or projected ratios, etc. The comparison of calculated ratios with the standards will help the analyst in forming his opinion about the financial situation of the concern.
Caliber of the Analyst
A wrong interpretation may create havoc for the concern since wrong conclusions may lead to wrong decisions. The utility of ratios is linked to the expertise of the analyst.
Ratios Provide Only a Base
A businessman will not afford a single wrong decision because it may have far-reaching consequences. The interpreter should use the ratios as a guide and may try to solicit any other relevant information which helps in reaching a correct decision.
FAQs About