
Table of Contents
- 1 What is Break Even Analysis?
- 2 Definition of Break Even Analysis
- 3 Meaning of Break Even Analysis
- 4 Assumptions of Break Even Analysis
- 5 Calculation of Break Even Analysis
- 6 PV Ratio and Margin of Safety
- 7 Applications of Break Even Analysis
- 8 Utility of Break Even Analysis
- 9 Advantages of Break Even Analysis
- 10 Limitations of Break Even Analysis
-
11 FAQs About Break Even Analysis
- 11.1 What is break even analysis meaning?
- 11.2 What is the definition of break even analysis?
- 11.3 What are the assumptions of break even analysis?
- 11.4 What is the utility of break even analysis?
- 11.5 What are the advantages of break even analysis?
- 11.6 What are the limitations of break even analysis?
- 11.7 What are the benefits of break even analysis?
What is Break Even Analysis?
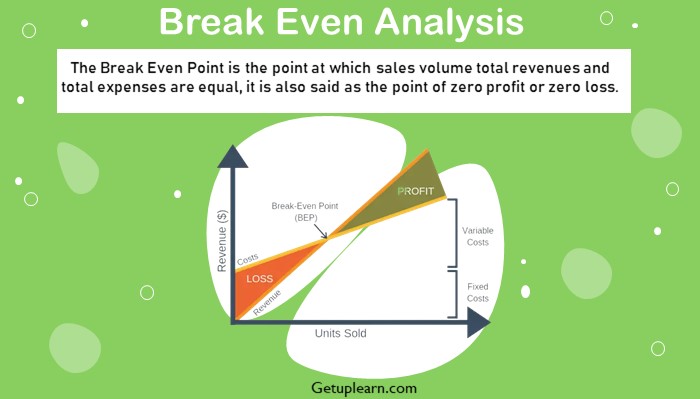
The Break Even Point is the point at which sales volume total revenues and total expenses are equal, it is also said as the point of zero profit or zero loss.
Break Even Analysis is a very important tool for for-profit management. With the help of break-even analysis, a firm can decide its volume of production for the desired amount of profit. Break Even Analysis helps a firm to find out its Break Even point or the point of sales at which no profit and no loss.
It plays a vital role in the pricing strategies also. Though it is a very useful tool but it should be applied very carefully. During its application, various factors of production & economy should be considered for the best result.
Break-even analysis is the most used financial analysis technique for financial planning and control in relatively simple situations. On the basis of the degree of responsiveness of the cost at various activity levels, it can be classified into three types: fixed costs, variable costs, and semi-variable costs.
The semi-variable cost falls somewhere between fixed and variable cost elements. The P/V ratio is an important tool for measuring the contribution in the present and estimating for the future.
Definition of Break Even Analysis
These are the definitions of break even analysis by authors:
[su_quote cite=”Keller and Ferrara”]The Break Even Point of a company or a unit of a company is that level of sales income which will equal the sum of its fixed costs and its variable costs.[/su_quote]
[su_quote cite=”G.R. Growningshield”]Break Even Point is the point at which sales revenue equals the cost to make and sell the product and neither profit nor loss is reported.[/su_quote]
[su_quote cite=”Charles T. Horngren”]The Break Even Point is the point at which sales volume total revenues and total expenses are equal, it is also said as the point of zero profit or zero loss.[/su_quote]
Meaning of Break Even Analysis
A break even analysis indicates the relationship between the costs and profits with sales volume. The sales volume which equals total revenue with related costs and results in neither profit nor loss is called break-even volume or point (BEP).
If all costs are assumed to be variable with sales volume, the BEP would be at zero sales. If all costs were fixed, profits would vary disproportionately with sales and the BEP would be at a point where total sales revenue equaled fixed costs.
However, both are purely hypothetical situations. In reality, costs consist of both fixed and variable elements. The break-even point is that point of sales volume at which total revenue is equal to the total cost.
It is a point of no profit, no loss. A business is said to break even when its total sales are equal to its total costs. The break-even point refers to the level of output that evenly breaks the costs and revenues.
At this point, contribution i.e. sales minus marginal cost equals the fixed cost and hence this point is often called a “Critical Point” “Equilibrium Point” or “Balancing Point”. If production/sales are increased beyond this level, there shall be profit to the organization and if it is decreased from this level, there shall be a loss to the organization.
The break-even point can be stated in the form of an equation:
Sales revenue at break-even point = Fixed Costs + Variable Costs.
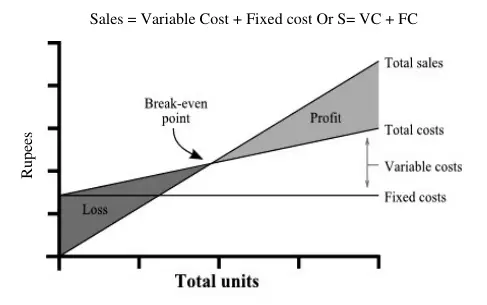
If sales exceed Break Even Point, profit arises and if sales fall below Break Even point, loss emerges. At Break Even Point, total sales and total costs are equal resulting in no profit no loss. Hence it can be shown as:
Sales = Variable Cost + Fixed cost Or S= VC + FC
Fixed Cost
Fixed Costs are those expense items that generally do not change in the short run regardless of how much you sell. Fixed costs are typically the expenses that you pay out regularly that do not go up or down with the sales level.
Examples of fixed costs include general office expenses, rent, depreciation, utilities, telephone, property tax, and the like. Obviously, all expenses vary over the long run.
Variable Cost
Variable Costs are those expenses that change with the level of sales. These costs vary with sales because they are directly involved in making the sale.
Assumptions of Break Even Analysis
These are the assumptions of break even analysis:
- Fixed cost remains constant at all volumes of output.
- There is a harmonization between production and sales.
- Generally productivity per worker remains constant.
- Price level generally remains constant.
- Variable cost remains constant per unit of output irrespective of the level of output and thus fluctuates directly in proportion to changes in the volume of output.
- The selling price per unit remains constant at all levels of output.
- All elements of cost (i.e. production, administration, and selling & distribution) can be classified into fixed and variable components.
Calculation of Break Even Analysis
There are two methods for the calculation of break even analysis:
Equation Method
This method uses the following which also expresses the relationship of the items of income statement.
Sales = Variable Expenses + Fixed Expenses + Profit
This simple equation may be used for any break-even or profit estimate situation. For example, the selling price is Rs. 10 per unit; the variable cost is Rs. 6 per unit and the fixed cost is Rs. 5000. Assuming that X is the number of units to be sold to break even, the values in the above formula can be substituted as:
| 10 X = 6 X + 5000 Or 10 X – 6 X = 5000 Or 4X = 5000 Or X = 5000/4 = 1250 units. |
Contribution Method
This method is a very important and useful method for the calculation of B.E.P. and its applications. This method involves two basic tools, i.e. “Contribution” and “Profit-Volume Ratio”.
Contribution: It means the difference between sales and the variables/marginal cost of sales. In other words, the excess of sales over its variable cost is called a contribution. It is also known as “Contribution Margin” and “Gross Margin”.
It can also be explained that contribution refers to the excess of sales over its variable costs which are available to cover fixed costs and to earn profit. If the amount of contribution is less than fixed cost, it will be a position of loss to the firm and if it is equal to fixed cost, it will be a situation of no profit and no loss.
Suppose, the selling price is Rs. 20 per unit and the variable cost is Rs. 16 per unit, then the contribution will be (20 – 16) Rs. 4 per unit. Similarly, if the total sales of a firm is Rs. 50000 and the total variable cost is Rs. 30000, then the contribution will be (50000 – 30000) Rs. 20000.
The concept of contribution is very useful from the point of view of managerial decisions and it can help the management in the following calculations:
- Determination of Break-even- point.
- Determination of selling price.
- Make or buy decisions. Selection of best option among various alternative products.
- Optimum product mix for maximizing profit.
The amount of contribution can be computed as follows:
- Contribution = Sales – Variable Cost
- Contribution = Fixed Cost + Profit / (- Loss)
- Contribution = Sales x P/V Ratio
- Contribution per unit = Sales per unit – Variable Cost per unit
PV Ratio and Margin of Safety
PV Ratio (Profit Volume Ratio) is a financial metric that represents the percentage of each unit’s contribution to sales revenue. It is calculated by dividing the contribution margin (sales revenue minus variable costs) by the sales revenue. The PV ratio is used to determine the level of sales volume needed to cover fixed costs and achieve a targeted profit.
The margin of Safety, on the other hand, is a financial metric that measures the extent to which actual or projected sales exceed the break-even point. In other words, it is the difference between the actual or projected sales volume and the break-even point. The margin of safety provides an indication of the level of risk associated with a particular business or investment and is often expressed as a percentage of the total sales revenue.
Profit-Volume Ratio
It is the ratio of contribution to sales and is expressed generally in terms of percentage. It is one of the most important ratios for studying the profitability of operations of a business.
The concept of the PV ratio is also useful to calculate the break-even point, the profit at a given volume of sales, the sales volume required to earn a desired profit, and the volume of sales required to maintain the existing profits if the selling price is reduced by a specified percentage.
The following formula can be used for the calculation of PV Ratio:
P/V Ratio = [Contribution X 100]/ Sales or
P/V Ratio = [Sales- variable cost]/Sales X 100
Example 1: If the Sales are Rs. 1000000 and Variable Cost Rs. 400000 than Calculate P/V Ratio.
Profit-Volume Ratio Example
| Solution: | |
| Sales Less: Variable Cost Contribution P/V Ratio = [Contribution X 100]/ Sales or P/V Ratio = [Sales- variable cost]/Sales X 100 |
1000000 400000 ——————— 600000 or (600000 x 100) / 100000 or 60% or (1000000 — 400000) / 1000000 x 100 P/V Ratio = 60%. |
The ratio of the contribution to sales is known as the PV ratio (profit-volume ratio). This ratio is significant for management accountants for decisions making. The ratio has certain special features:
- It enables management to ascertain the total contribution in terms of rupees for a given level of sales.
- It remains constant so long as the selling price and variable cost per unit remain constant or vary proportionately.
- It is unaffected by any change in the level of activity. Hence, the ratio would be constant whether studied on 10,000 units basis, 100 units basis, or a single-unit basis.
- The ratio is unaffected by any change in the fixed cost because the latter does not enter into the computation of contribution at all.
A substitute for the PV ratio is “contribution per unit”. This is also an equally effective tool for the management accountant in analyzing data. The significance of the PV ratio or contribution per unit is varied and far-reaching.
Margin of Safety
The margin of safety (safety margin) is the difference between the intrinsic value of a stock and its market price. Another definition: In Break-even analysis (accounting), the margin of safety is how much output or sales level can fall before a business reaches its breakeven point.
-
MOS in Investing: Margin of safety is a principle of investing in which an investor only purchases securities when the market price is significantly below its intrinsic value. In other words, when the market price is significantly below your estimation of the intrinsic value, the difference is the margin of safety.
- Calculation of MOS: The margin of safety formula is calculated by subtracting the break-even sales from the budgeted or projected sales. This formula shows the total number of sales above the breakeven point. In other words, the total number of sales rupees that can be lost before the company loses money.
MOS= Actual Sales – BEP Sales
|
MOS percentage = |
(Actual Sales – BEP Sales) —————————————————– x100 Actual sales |
For example, if the price is Rs.10 and the unit variable cost is Rs. 2, then the unit contribution margin is Rs. 8, and the contribution margin ratio is Rs. 8/ Rs. 10 = 80%. Profit and Loss as Contribution minus Fixed Costs. The contribution margin can be thought of as the fraction of sales that contributes to the offset of fixed costs.
Applications of Break Even Analysis
Break-even analysis is a very useful and important technique of profit planning and decision-making. It can be applied to selecting the best proposal, testing the profitability of proposed actions, and for various other decisions. The applications of break even analysis are:
- Determination of sales to earn desired profit.
- Fixation of new selling price at a particular break-even point.
- Estimation of margin of safety.
- Estimation of effects of change in fixed and variable costs on B.E.P. and sales.
- Calculation of necessary sales to cover proposed expenses.
- Determination of Break-even point.
- Calculation of profit at different levels of sales.
- Make or buy decisions.
- Determination of optimum sales mix.
- Decision of change of capacity.
Utility of Break Even Analysis
Break Even Analysis is a very vital technique of profit management. It is a tool that explains the relationship between cost, volume, and profits. The utility of Break Even Analysis is the following:
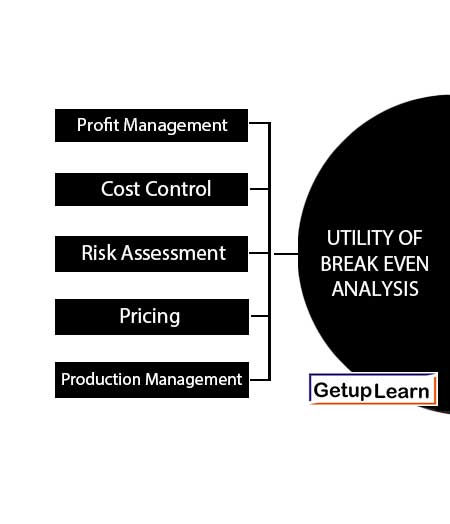
Profit Management
The Break Even Analysis is a very important tool in the hand of managers to manage the profit of an organization. With the help of break-even analysis sales volume of required profit may be ascertained very easily.
Cost Control
Break Even Analysis is very useful in cost controlling also. It provides detailed information and composition about fixed costs and variable costs. Hence it is very helpful in cost control.
Risk Assessment
Break Even Analysis provides a base for the assessment of the risk of loss due to low sale volume. With the help of Break Even Analysis, we can find out the amount of minimum sales volume below which the firm will incur a loss.
Pricing
Break Even Analysis plays a very important role in pricing also. An effective pricing strategy may be formulated by exercising break-even analysis.
Production Management
Break Even Analysis may be applied in production management for determining output level. It is very important to produce an optimum level of goods for improving profitability. Break Even Analysis helps in determining an optimum output level.
Advantages of Break Even Analysis
These are the advantages of break even analysis explained below:
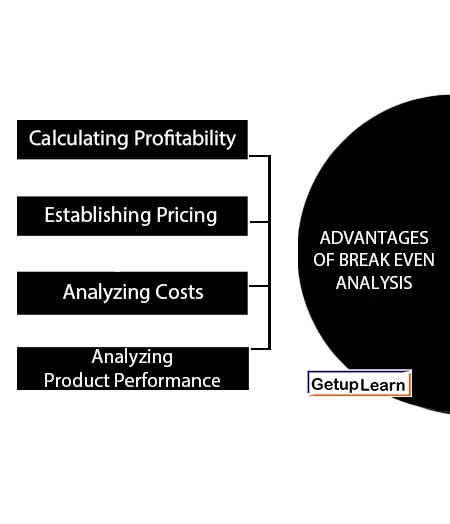
Calculating Profitability
Knowing when your business starts to generate profit can aid in setting realistic revenue goals, which can be achieved by determining the number of units needed to be sold.
Establishing Pricing
Determining prices is an essential aspect of business operations. While competitive markets may influence pricing decisions, it is important to consider the break-even point. Additionally, comprehending how pricing strategies impact gross margin is imperative for preserving a sound financial standing.
Analyzing Costs
Conducting a break-even analysis is an effective approach for assessing business expenses, specifically fixed costs. In order to maintain profitability, it is essential to monitor and control costs.
By tracking changes in total expenses, you can identify any overlooked expenses and promptly address them. Moreover, performing regular break-even analysis allows you to detect any trends in business costs and detect any potential increases in variable costs per unit.
Analyzing Product Performance
Determining and tracking the break-even point aids in evaluating a product’s contribution margin and performance. Additionally, it is a valuable tool to assess the risk involved in introducing new products.
Products that require significant investment or have poor sales performance may require a longer time to generate profit. Similarly, products or services with low contribution margins can prolong the time required for the business to become profitable.
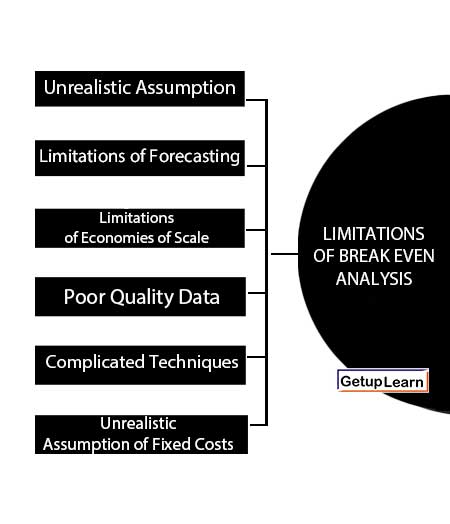
Limitations of Break Even Analysis
These are the limitations of break even analysis summarized below:
- Unrealistic Assumption
- Limitations of Forecasting
- Limitations of Economies of Scale
- Poor Quality Data
- Complicated Techniques
- Unrealistic Assumption of Fixed Costs
Unrealistic Assumption
It assumes that all output is sold at the given price which is unrealistic.
Limitations of Forecasting
Although it can cope with changes in circumstances, these factors change regularly reducing its usefulness as a forecasting tool.
Limitations of Economies of Scale
The model assumes that costs increase constantly and do not benefit from economies of scale. If the firm obtains purchasing economies of scale then its total cost line will no longer be straight.
Poor Quality Data
Break even analysis is only as good as the data upon which it is based. Poor quality data will lead to inaccurate conclusions being drawn.
Complicated Techniques
Not all costs can be conveniently classified into fixed and variable costs. The introduction of semi-variable costs will make the technique more complicated.
Unrealistic Assumption of Fixed Costs
It is also unrealistic sometimes that fixed costs will remain unchanged at different output levels up to a maximum capacity.
FAQs About Break Even Analysis
What is break even analysis meaning?
The Break Even Point is the point at which sales volume total revenues and total expenses are equal, it is also said as the point of zero profit or zero loss.
What is the definition of break even analysis?
The Break Even Point of a company or a unit of a company is that level of sales income which will equal the sum of its fixed costs and its variable costs. by Keller and Ferrara
What are the assumptions of break even analysis?
The following are the assumptions of break even analysis:
1. Fixed cost remains constant at all volumes of output.
2. There is a harmonization between production and sales.
3. Generally, productivity per worker remains constant.
4. Price level generally remains constant.
What is the utility of break even analysis?
The utilities of break even analysis are:
1. Profit Management
2. Cost Control
3. Risk Assessment
4. Pricing
5. Production Management.
What are the advantages of break even analysis?
The advantages of break even analysis are:
1. Calculating Profitability
2. Establishing Pricing
3. Analyzing Costs
4. Analyzing Product Performance.
What are the limitations of break even analysis?
The following are the limitations of break even analysis:
1. Unrealistic Assumption
2. Limitations of Forecasting
3. Limitations of Economies of Scale
4. Poor Quality Data
5. Complicated Techniques
6. Unrealistic Assumption of Fixed Costs.
What are the benefits of break even analysis?
The following are the benefits of break even analysis:
1. It is simple to conduct and understand.
2. It shows profit and loss at different levels of output.
3. It can cope with changing circumstances.
4. It provides useful guidelines to management on break-even points, safety margins, and profit/loss levels at different rates of output.
5. Comparisons can be made between different options by constructing new charts to show changed circumstances.