Table of Contents
What is Sales Analysis?
Sales analysis is the process of examining sales data to gain insights and understand various aspects of a company’s sales performance. It involves analyzing sales trends, patterns, and metrics to evaluate the effectiveness of sales strategies and make informed business decisions.
Through sales analyses, management seeks insights on strong and weak territories, high-volume and low-volume products, and the types of customers providing satisfactory and unsatisfactory sales volume. Sales analysis uncovers details that otherwise lie hidden in the sales records. It provides information that management needs to allocate sales efforts effectively. These aspects are discussed below considerably:
Allocation of Sales Efforts
A small percentage of the territories, customers, products, or orders bring in a high percentage of the sales in many businesses and vice-versa. In most of the companies, eighty percent of the customers accounted for only fifteen percent of the sales. Comparable situations exist in most companies.
This is an example of the ‘iceberg principle’; only a small part of the total situation is above the surface and known while the submerged part is less than the surface and unknown. Sales analysis detects such situations, alerting management to opportunities for improving the operations in the organization.
Sales efforts and selling expenses ordinarily are divided on the basis of customers, territories, orders, and so forth, rather than on the basis of sales potentials or actual sales. It usually costs as much to maintain sales personnel in poor territories as in good ones, and almost as much to promote a slow-selling product as one that sells.
It costs as much to have sales personnel call on customers who give small orders as on those who place large orders. Normally, a large proportion of the total spending for personal-selling efforts brings in a small proportion of the total sales and profits. Sales analysis detects these situations.
Data for Sales Analysis
Data availability for sales analysis varies in all companies. At one extreme, some have no data other than the accounting system records as sales are made, and, of course, copies of sales invoices. On the other hand, some maintain detailed sales records and have data readily available for use in making all types of analyses.
The original sources of data for sales analysis are the sales invoices. In a company with a good information system, detailed data from sales invoices are transferred to computer tapes or data-processing cards.
The information on each transaction identifies the customer in terms of name, geographical location, and so on; the salesperson in terms of name, territory, etc.; and includes such sales data as order date, products sold and quantities, price per unit, total dollar sales per product, and total order amount. With information stored by the sales organization, sales analyses are performed quickly and at a low cost.
Objectives of Sales Analysis
The sales analyses portray the strengths and weaknesses of a sales organization in terms of sales, and each type of sales analysis glimpses different aspects. The sales territories analysis depicts about that the particular product where it can be sold. Analysis of sales by products answers how much of what is being sold.
Analysis of sales by customers’ answers about who is buying how much: All sales analyses relate to how much is being sold, but each answers the question in a different way. Sales analyses identify different aspects of sales strengths and weaknesses, but they cannot explain why strengths and weaknesses exist. In addition to the above, sales analysis answered four questions of the sales manager:
- It revealed the sales territories with good and poor performances.
- It showed that whom so ever salespersons are above; at par and below the quota given to them.
- It indicated that Edwards’ performance improved as accounts got smaller, but was unsatisfactory with all sizes of accounts.
- Where sales were weak and strong, which salespersons were performing above or below quota, which classes of accounts were buying, and which products were being sold.
Elements of Sales Analysis
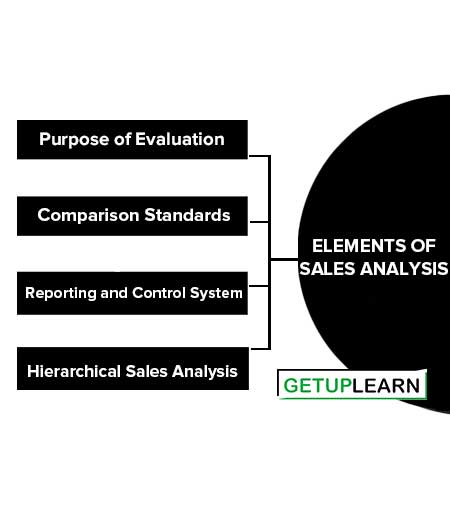
A typical sales analysis involves comparing the sales of the company at two different time periods or comparing the sales with external data to exercise better control over the performance of the sales function. The key elements of sales analysis process are described below:

Purpose of Evaluation
A sales manager must determine the purpose of the evaluation before starting the analysis. A basic sales analysis lists current sales variables and their values, while a comparative analysis compares sales performances across territories or time periods.
The manager also decides on the required information, such as total sales volume, territory-wise sales, product line sales, and sales personnel performance.
Identifying information needs can be challenging as strengths and weaknesses are revealed through sales activity analysis. Different organizational levels have varying information requirements, and the sales manager selects the data source and report type.
Comparison Standards
A simple sales analysis simply states facts whereas a comparative sales analysis compares the sales figures with some standards. Standards are the yardsticks to evaluate the effectiveness of a system. There are different standards that sales managers can use to determine the efficiency of the sales function in the organization.
The effectiveness of the sales function can be measured in an absolute or relative sense. An absolute measure is an expected or an ideal measure. The performance of the sales function can also be measured in relative terms. The average sales volume is an example of an average or relative standard of measurement.
Reporting and Control System
Companies utilize sales information systems to store and process data, generating reports that depict trends, seasonal patterns, regression analysis, etc. These reports serve both for evaluating the sales force and forecasting sales.
Sales managers are concerned about the report type and its contents, finding reports focused on exceptions, such as significantly high or low sales figures, to be valuable. Additionally, managers must decide on the necessary source inputs and processing methods for report generation.
The sales invoice is commonly used as a source, along with cash register receipts, salesperson call reports, expense reports, financial records, warranties, etc. Aggregating sales variables is another critical decision in sales analysis to avoid analyzing individual transactions or solely focusing on aggregate sales, as neither serves the purpose of sales analysis.
Hierarchical Sales Analysis
It involves studying the sales performance at a micro level by investigating and analyzing its components. This helps sales managers to pinpoint any weakness and the cause for it.
This will help identify if there are any fundamental reasons adversely affecting the performance of sale personnel in a particular area, such as poor economic conditions, high unemployment, fierce competition, low sales morale, etc.
Process of Sales Analysis
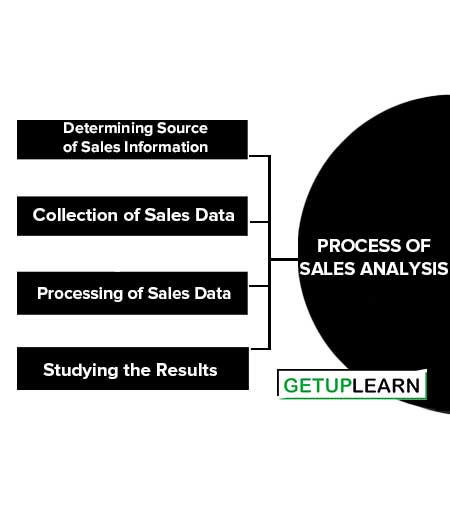
Having decided on the purpose of sales analysis and the information that is needed from it, a sales manager can perform a sales analysis. These are the steps of the process of sales analysis:
- Determining Source of Sales Information
- Collection of Sales Data
- Processing of Sales Data
- Studying the Results

Determining Source of Sales Information
The most critical element in sales analysis is sales information. There are many sources of sales information that include data from the marketing information system, company records, customers, sales personnel, field visits, and insights of the manager as well as external sources such as newspaper and magazine reports, trade, journals, etc.
Collection of Sales Data
The sales data is collected from sales invoices, historical records of sales volume, customer complaints, bills of sale, cash registers, etc.
The sales invoice identifies the amount and type of products that customers have bought. This source document should capture that data in a format that can be easily read and processed.
Processing of Sales Data
Most firms use an information system to capture, store and process sales data. Typical sales information systems provide more functionality than just supporting sales analysis. Sales managers can also use the information system to help them in other sales activities like sales planning, forecasting, etc.
Studying the Results
Sales analysis only indicates what additional investigation is required; it does not offer a solution. The result of sales analysis should be carefully studied to identify the facts and acquire a lead for further analysis. It does not indicate the reasons for good or bad performance.
Bases for Analysing Sales Volume
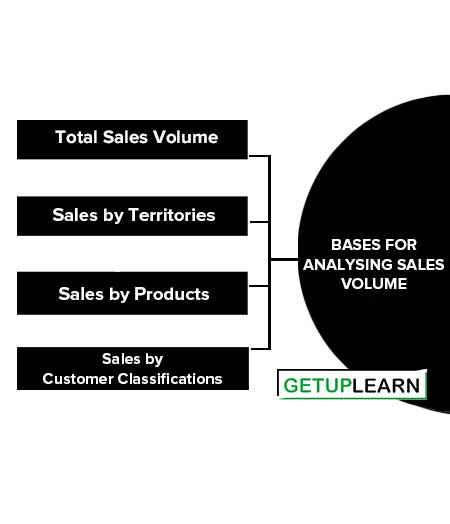
Following are a few bases for analyzing sales volume:

Total Sales Volume
It is a combined sale of all products in all territories for all customers. The study of total sales volume requires the following data:
- The annual sales figures for the company over the past several years,
- The annual industry sales in the geographic market are covered by the firm. From these figures, the company’s share of the market can be determined.
Sales by Territories
Analysis of sales volume by territories helps management to identify which territories are strong and which are weak in relation to sales potential.
Sales by Products
A few products may bring most of the sales volume (80-20 rule). There is no relation between volume and profit. Products having a high volume of sales may not contribute a high percentage of net profits.
Types of sales volume analysis by-products that may be helpful to sales management are:
- A summary of present and past total sales divided into individual products or groups of products, which helps sales managers to study the sales trend for each individual product/group of products.
- Sales of each product line in each territory can be used to determine the geographical market in which each product is strong or weak.
As a part of sales volume analysis by products, sales managers must decide what to do about low-volume products and products that did not meet their goals.
Sales by Customer Classifications
80-20 principles are applicable to sale analysis by customers. A small percentage of customers account for a major share of total sales volume. In addition, a firm may sell to many accounts on a marginal or even unprofitable basis. Sales volume by customer groups is analyzed in the following ways:
- Accounts on an industry basis
- By channel of distribution
- On the basis of accounts (e.g., key accounts)
- Combination basis
Any of these customer classifications usually should be analyzed for each territory and for each line of products. A sales volume analysis alone usually does not furnish enough information to the sales department. The rupee sales volume does not provide any data regarding gross margin.
Hence, a marketing profitability analysis is ideal. Therefore, sales performance measures include marketing–cost analysis and profitability analysis in addition to sales volume analysis. When the sales volume analysis includes the cost of merchandise sold, the sales manager can do a gross margin analysis by territories, products, or customer groups.
Principles of Sales Analysis
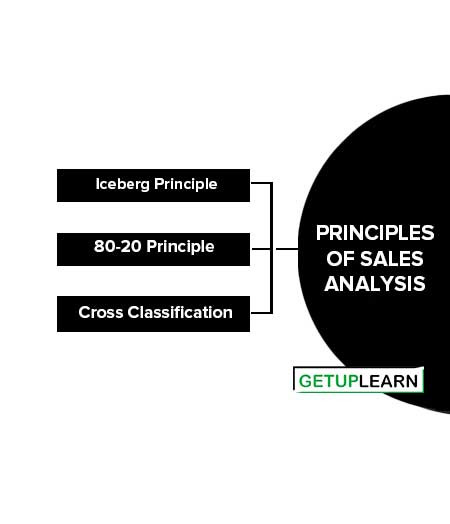
The sales cost and profitability analyses are based on the principle that not every factor affecting the sales and the marketing function is revealed completely unless the details are probed. Let’s discuss the principles of sales analysis:

Iceberg Principle
The iceberg principle suggests that aggregating the total sales figures of a firm and comparing them with past performance may reveal a positive picture of sales even though there may be a larger problem concealed. When individual sales figures are aggregated into totals, values that are too high or too low offset each other and so lose their significance.
All strengths and weaknesses may not be revealed when aggregates are used for analysis. The same rule applies to marketing costs as well. Total costs may not reveal all aspects of the costs incurred or all the details that are necessary for efficient cost control.
This is like the visible portion of an iceberg is only a minute fraction of what is underneath and thus the term ‘iceberg principle’. Therefore, in order to obtain accurate and complete information about the sales figures, the sales data should be broken down into individual sales segments.
80-20 Principle
The 80-20 principle, is also called the Pareto principle. The 80-20 rule states that 20% of the elements are responsible for 80% of the results. This rule can be applied to all areas of business and helps management to focus on the real problem or issues.
In sales analysis, this principle states that 80% of a firm’s sales volume comes from 20% of its customers. Thus, not all business units of a firm contribute equally to profitability. Firms facing the 80/20 situation can adopt certain strategies to alter the ratio and increase their profits.
This rule has a similar implication for the costs and expenses as well. Cost analysis of firms shows that about 15% of expense categories account for about 80 % of all expenses. Therefore, management should focus its attention on designing measures that address the 15% category of costs that contribute to the bulk of expenses of the firm.
Cross Classification
It can be used when the sales data has to be analyzed on the basis of more than one category. If sales managers require information on both customer and product categories, either they can opt for two separate analyses, one by-product and the other by the customer, or they can go for one analysis, by customer cross-classified by product.
It helps the sales managers to arrive at the same information but with the product-customer detail added. It involves more than two categories that complicate the information.
Problems in Sales Analysis
The sales analysis is dependent on accounting records for gross sales and sales returns. Therefore, if there are flaws in the accounting system, the sales analysis is affected and it might not give a true picture of the strengths and weaknesses of the salesmen’s selling efforts.
Though a sales analysis identifies the problems and their causes, it does not really reflect the performance of the company in relation to the industry or its competitors. It also does not emphasize sales profitability.
A sales analysis only talks about sales volume and does not give any indication of whether the sales were profitable for the company. To analyze the profitability of sales, a distribution or marketing cost analysis has to be done.
FAQs About the Sales Analysis
What are the elements of sales analysis?
Here the elements of sales analysis are:
1. Purpose of Evaluation
2. Comparison Standards
3. Reporting and Control System
4. Hierarchical Sales Analysis.
What is the process of sales analysis?
Having decided on the purpose of sales analysis and the information that is needed from it, a sales manager can perform a sales analysis by:
1. Determining the Source of Sales Information
2. Collection of Sales Data
3. Processing of Sales Data
4. Studying the Results.
What are the principles of sales analysis?
Iceberg Principle, 80-20 Principle, and Cross Classification are three major principles of sales analysis.
