In an open competitive market, it is the interaction between demand and supply that tends to determine price and quantity. This can be shown by bringing together demand and supply.

Table of Contents
Theory of Price Determination
It can be shown by the following schedule:
Determination of Price
| S.No | Price (Rs.) | Demand (Units) | Supply (Units) |
| 1. | 1 | 60 | 5 |
| 2. | 2 | 35 | 35 |
| 3. | 3 | 20 | 45 |
| 4. | 4 | 15 | 55 |
| 5. | 5 | 10 | 65 |
When we plot the above points on a single graph with price on Y-axis and quantity demanded and supplied on X-axis, we get a figure like this:
Determination of Equilibrium Price
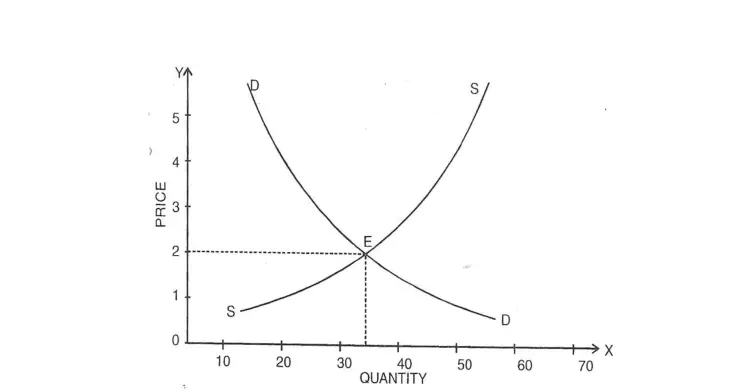
It is easy to see which will be the market price of the commodity. It cannot be Re. 1, for at that price there would be 60 units in demand, but only 5 units on offer. Competition among buyers would force the price up. On the other hand, it cannot Rs. 5, for at that price there would be 65 units on offer for sale but only 10 units in demand.
Competition among sellers would force the price down. At Rs. 2, demand and supply are equal (35 units) and the market price will tend to settle at this price. This is the equilibrium price and quantity — the point at which price and output will tend to stay. Once this point is reached we will have a stable equilibrium. It should be noted that it would be stable only if other things were equal.
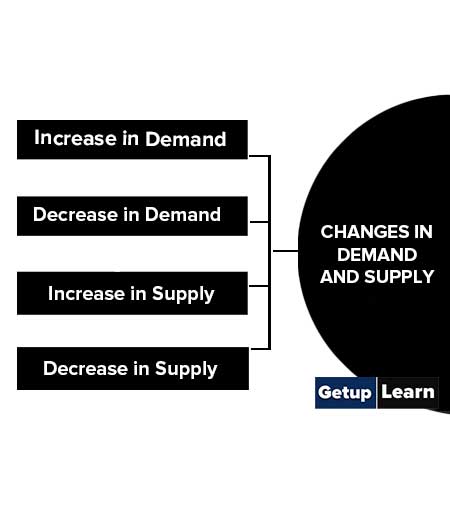
Changes in Demand and Supply
The facts of the real world, however, are such that other things (like income, tastes and preferences, population, etc.) always change causing changes in the demand and supply. The four main changes in demand and supply are:
An Increase in Demand
In the figure, the original demand curve is DD and the supply curve is SS. At equilibrium price OP, demand and supply are equal to OQ.
Now suppose the money income of the consumer increases, the demand curve will shift to D1D1 and the supply curve will remain the same. We will see that on the new demand curve D1D1 at OP price demand increases to OQ2 while supply remains the same i.e. OQ. Since supply is short of the demand, price will go up to OP1.
With the higher price supply will also shoot up and a new equilibrium between the demand and supply will be reached. At this equilibrium point, OP1 is price and OQ1 is the quantity that is demanded and supplied.
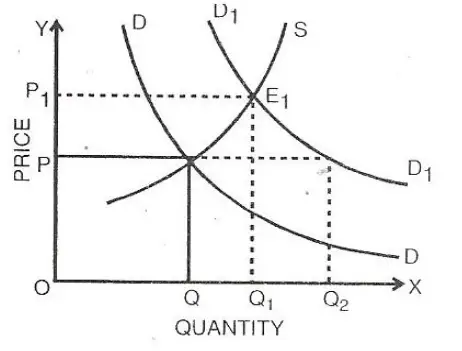
Thus, we see that as a result of an increase in demand, there is an increase in equilibrium price, as a result of which the quantity sold and purchased also increases.
Decrease in Demand
The opposite will happen when the demand falls as a result of a fall in income, while the supply remains the same. The demand curve will shift to the left and become D1D1 while the supply curve remains as it is. With the new demand curve D1D1 at original price OP.
OQ2 is demanded and OQ is supplied. As the supply exceeds demand, the price will go down and the quantity demanded will go up. A new equilibrium price OP1 will be settled in the market where demand OQ1 will be equal to supply OQ1.
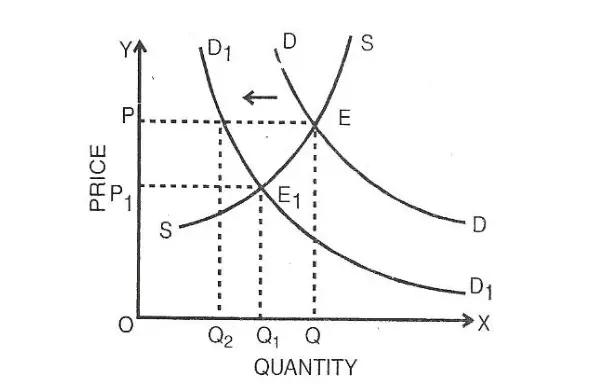
Thus with a decrease in demand, there is a decrease in the equilibrium price and quantity demanded and supplied.
Increase in Supply
Let us now assume that demand does not change, but there is an increase in supply say, because of improved technology.
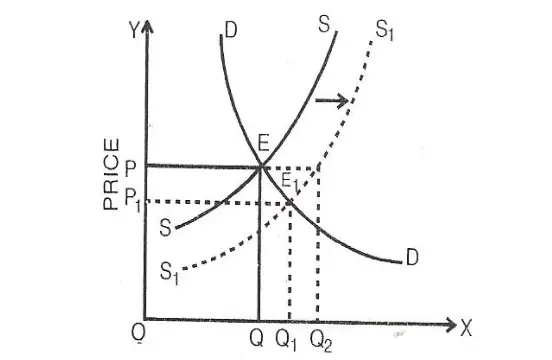
The supply curve SS will shift to the right and become S1S1. At the original equilibrium price OP. OQ is demanded and OQ2 is supplied (with new supply curve). Since the supply is greater than the demand, the equilibrium price will go down and become OP1 at which OQ1 will be demanded and supplied. Thus, as a result of an increase in supply the equilibrium price will go down and the quantity demanded will go up.
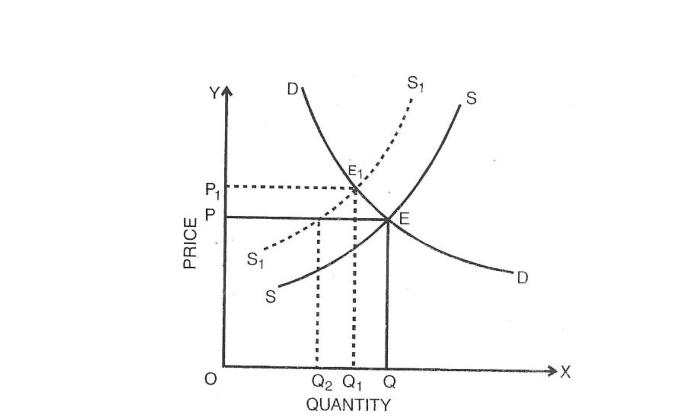
Decrease in Supply
If because of some reason, there is a decrease in the supply we will find that equilibrium price will go up but the amount sold and purchased will go down as shown below:
Simultaneous Change in Demand and Supply
Upto now, we were considering the effect of change either in demand or in supply on the equilibrium price and the quantity sold and purchased. There may be cases in which both the supply and demand change at the same time. During a war, for example, shortage of goods will often decrease supply while full employment causes high total wage payments which increase demand.
We may explain the changes in both demand and supply with the help of diagrams as follows:
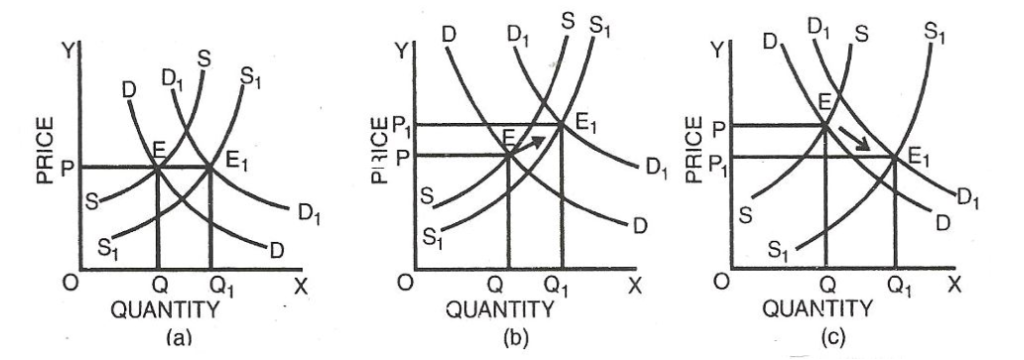
Diagram 6 shows simultaneous change in demand and supply and its effects on the equilibrium price. In the figure, the original demand curve DD and the supply curve SS meet at E at which OP is the equilibrium price OQ is the quantity bought and sold. Diagram 6 (a), shows that increase in demand is equal to increase in supply. The new demand curve D1D1 and S1S1 meet at E1. The new equilibrium price is equal to the old equilibrium price (OP).
Diagram 6 (b), shows that increase in demand is more than increase in supply. Hence, the new equilibrium price OP1 is higher than the old equilibrium price OP. Opposite will happen i.e. the equilibrium price will go down if there is a simultaneous fall in the demand and supply and the fall in demand is more than the fall in supply.
Diagram 6(c), shows that supply increases in a greater proportion than demand. The new equilibrium price will be less than the original equilibrium price. Conversely, if the fall in the supply is more than proportionate to the fall in the demand, the equilibrium price will go up.
What are the factors of price determination?
There are some changes which factors of price determination like changes in An Increase in Demand, Decrease in Demand, Increase in Supply, Decrease in Supply.