Table of Contents
What is Cost Output Relationship in Long Run?
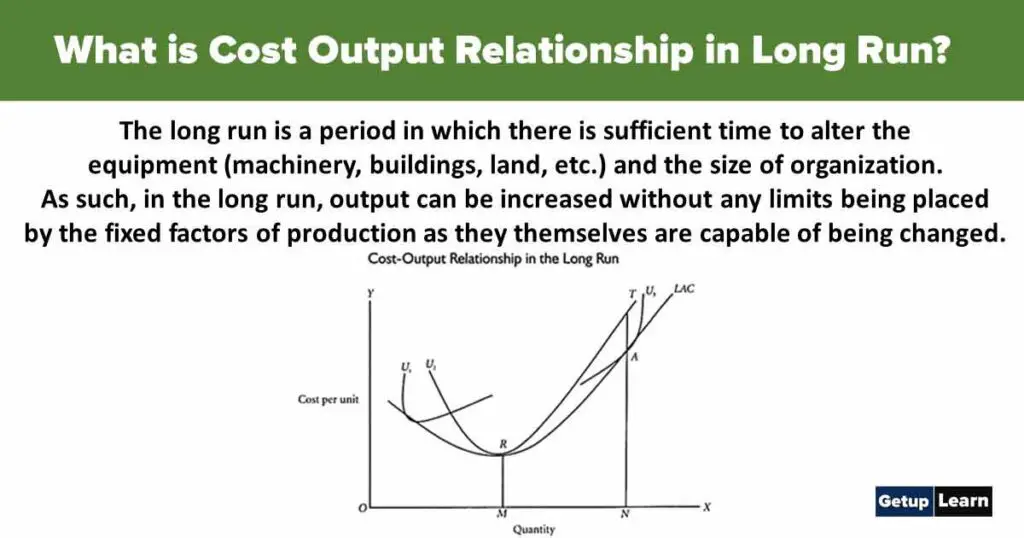
A long period is that period in which the producer can make all required changes in each factor of production. In long period, due to a longer time duration, any firm can change all its factors of production, production methods and scales of production.
Cost Output Relationship in Long Run
That is why Spencer has said, in the long term production function no factor is fixed, due to the long time period and no cost of the firm is fixed. In the long period, long-run marginal cost and long run average cost have an important role in price determination, which is explained, as follows:
Long Run Average Cost
Long Term average cost is calculated by dividing long term total cost by the units of production. Long run average cost curve explains the minimum long run average cost at various quantities of production. In other words, the curves framed by touching various short term average cost curves for production are known as long run average cost curves. It may be explained by the diagram also.
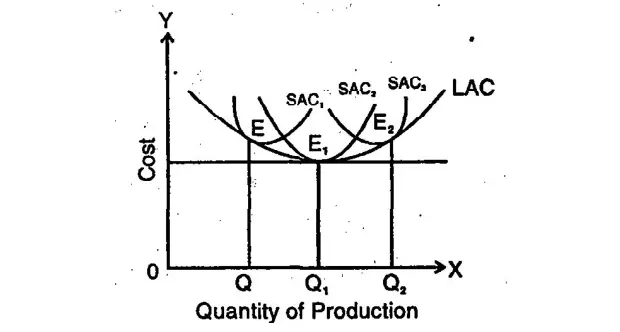
In this diagram, long term average cost, LAC has been shown. In LAC curve, short term AC Curves. SAC1, SAC2 and SAC3 have been shown. It should be remembered here that SAC1 and SAC2 and SAC3 are the best plants of different production levels, like (1) SAC, curve plant OQ, (2) SAC2, curve plant, show the best quantity of OQ1 and (3) SAC3 curve plant production quantity of OQ2.
If a curve is drawn by Joining these various curves from each other, the LAC curve will be formed. The characteristics of long term average cost may be explained by this diagram.

- Long term average cost (LAC) is the envelope of all short term average cost curves (SACs). That is why LAC is also known as the envelope curve.
- LAC is always less than SAC. That is why all SAC curves are located above LAC.
- LAC indicates the minimum cost of production and optimum size of the firm (Law of constant returns).
- LAC curve only touches the SAC curves and does not cuts them.
- LAC curve is also U shaped like SAC curves, but LAC curve is flatter as compared to SAC.
- LAC curve does not touch all SAC curves at their lowest points.
LAC touches SAC at its lowest point at its own lowest points. Till the LAC curve falls, it touches the falling parts of SAC curves and when the LAC curve rises upwards, then it touches the rising part of SAC curves.
Long Run Marginal Cost
Long run marginal cost curve is also ‘U’ shaped. In the long term difference between fixed costs and variable costs comes to an end. All costs become variable and total variable cost and total cost become equal. Hence, in long run, marginal cost can be expressed or defined in the terms of variable cost. The total cost in the longer term due to the production ‘of one additional unit is known as long run marginal cost.
Long run marginal cost and long term average cost have the same relationship which is in short term marginal cost and short term average cost.
It is clear from the diagram that when LAC falls, then LMC is less than it. At the lowest point P of LAC, SMC becomes equal. Thereafter LAC increases and LMC remains higher than that. In the diagram, SAC and SMC are short term average cost curves and short term marginal cost curves, respectively. Thus, it is clear that at point P, LAC = LMC = SAC = SMC.
Why LAC Curves U-shaped
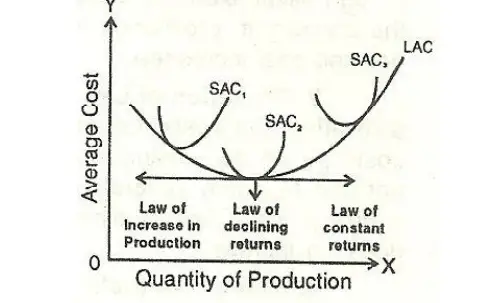
In the short run, the SAC curve is U-shaped because the laws of returns operate but in the long run, LAC is also U-shaped because the Laws of Returns to scale operate namely the law of increasing return to scale, the Law of Constant Returns to scale and the Law of Diminishing Returns to scale.
As the level of output is expanded or the scale of operation is increased by the large firm they will enjoy economies of scale but if these firms produce beyond their installed capacity then they might get diseconomies of scale. Economies of scale bring down the fall in unit cost and diseconomies result in rising in it.
What is cost output relationship in long run and short run?
A long period is that period in which the producer can make all required changes in each factor of production. In a long period, due to a longer time duration, any firm can change all its factors of production, production methods and scales of production.
Why is the long run average cost U shaped?
In the short run, SAC curve is U-shaped because the laws of returns operate but in the long run, LAC is also U-shaped because the Laws of Returns to scale operate namely law of increasing return to scale, Law of Constant Returns to scale and the Law of Diminishing Returns to scale.