Table of Contents
What is Cost Output Relationship in Short Run?
Cost and output are closely related because they affect each other. Time element plays an important role in the price determination of a firm’s cost. During a short period, two types of factors are employed. One is a fixed factor while others are variable factors of production.

The fixed factor of production remains constant with a change in production, while only variable inputs can be varied. Raw material, semi-finished material, unskilled labour, energy etc. are variable inputs that can be changed during the short run. Machines, capital, salaries of managers and technical experts are included in fixed inputs.
During a short period, an individual firm can change variable factors of production according to requirements of production while fixed factors of production cannot be changed.
Cost Output Relationship in Short Run
The cost output relation during the short period can be shown as below:
Short Run Total Costs
Short run total costs of a firm are classified as follows:
Total Costs
Those expenses which are incurred by a firm in the production of any commodity are included in it or total cost is the aggregate of total fixed cost and total variable cost. Total costs are calculated as follows:
Total cost (TC) = Total fixed cost (TFC) + Total Variable cost (TVC)
Total costs change due to change in the total variable cost only during a short period because total fixed costs (TFC) remain constant. Short-run total costs can be shown from the following table:
Short Run Total Costs
| Output (Units) | Total fixed cost (TFC) Rs. | Total Variable cost (TVC) Rs. | Total Cost (TC) Rs. |
| 0 | 100 | 0 | 100 |
| 2 | 100 | 60 | 160 |
| 3 | 100 | 80 | 180 |
| 4 | 100 | 90 | 190 |
| 5 | 100 | 100 | 200 |
| 6 | 100 | 120 | 220 |
| 7 | 100 | 150 | 250 |
| 8 | 100 | 190 | 290 |
| 9 | 100 | 240 | 340 |
| 10 | 100 | 320 | 420 |
The table shows that total fixed cost remains constant when the production is zero or it is increasing while total variable cost is zero when production is zero and it changes with the change in output and the total cost is the summation of total fixed cost and total variable cost.
Total Fixed Cost (TFC)
Those costs which remain constant when the output is zero as well as it is increasing are called total fixed costs. Such costs are borne by the firm whether there is production or not. Plant, land and building, machinery, tools, equipment, implements, contractual rent, insurance fee, maintenance cost, property tax, the interest of the capital, manager’s salary etc. are the items which are included in total fixed costs.
These costs are borne even there is zero production during a short period. Table 1 shows when production is zero the total fixed cost is Rs. 100 and when it is 10 units even then it is Rs. 100. Hence, total fixed costs remain constant. TFC is shown in diagram 2 which is perfectly horizontal to the ox-axis.
Total Variable Costs (TVC)
Those costs vary with the production of a commodity during a short period and they have a direct relationship with the change in production. When Production is zero these costs will be zero and when production increases they will move in the same direction.
These costs are incurred on raw materials, direct wages and expenses on energy or power. Variable costs are also called prime costs or direct costs. Total variable costs are shown in diagram 2. Thus, the total cost is the summation (aggregates) of total fixed costs and total variable costs. All these costs are related to short-run production. They are shown in diagram 2 on the basis of table 1.
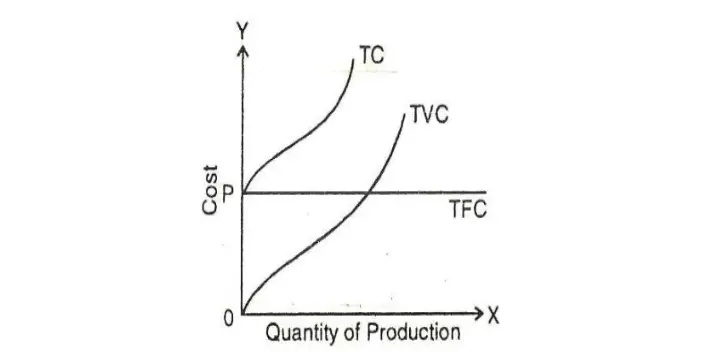
Diagram 2 shows TC, TFC and TVC. TFC is parallel to OX-axis and it remains constant whether production is zero or it is 10 units. TVC starts from zero production where it is zero and goes on increasing with the increase in output. TC is the total of TFC and TVC. When production is zero total cost is equal to TFC and it increases with an increase in production. The difference between TVC and TC is equivalent to TFC which remains constant.
Average Costs or Unit Costs
During short period average costs or per-unit costs can be classified into the following categories:
Average Fixed Cost (AFC)
The average fixed cost is the total fixed cost divided by the units of output. There is an inverse relationship between output and average fixed cost. With the increase in output average fixed cost decreases and with the decrease in output, the average fixed cost will increase.
The shape of the average fixed cost becomes a rectangular hyperbola with an increase in output. It is calculated by using the following formula:
AFC = TFC/Q
Q is the volume of output, AFC and TFC are an average fixed cost and total fixed cost.
Average Variable Cost (AVC)
The average variable cost is the total variable cost divided by the volume of output. The average variable cost falls with the increase in output, reaches its minimum and then starts rising. The operation of the law of increasing returns the AVC decreases, the operation of constant returns leads to constancy in AVC and the law of diminishing returns leads to an increase in AVC.
The shape of AVC is U-shaped because of the operation of the laws of returns during short period. The AVC is calculated by using the formula given below:
AVC = TVC/Q
AVC and TVC are average variable costs and total variable costs while Q is the volume of output.
Average Cost (AC)
The average cost is also called average total cost (ATC) during short period because it is the aggregate of AFC and AVC. AC can be calculated by dividing total cost (TC) by the volume of output or by aggregating AVC and AFC. Following is the formula of calculating AC:
AC = TC/Q
AC and TC are average cost and total cost while Q is the volume of output. Another formula for the calculation of AC is as given under:
AC = AFC + AVC
The AC curve decreases with the increase in output and remains constant upto a point and thereafter it increases with the increase in output. Its shape is U- shaped due to the operation of the law of returns during the short period.
Marginal Cost (MC)
It is an addition to the total cost by producing an additional unit of output. It can be calculated as the change in total cost divided by an additional unit change in the output. The formula for its calculation is as given below:
Mc = ∆TC ÷ ΔQ
MC is marginal cost, Δ TC is changed in TC and Δ Q is a change in the volume of output
For example, if the total cost (TC) of 5 units of a commodity is Rs. 550 and 6 units of a commodity is Rs. 600, then the marginal cost of the 6th unit is Rs. 50. It can be calculated on the basis of the above formula as given under:
MC = 50/1 = 50 or Rs. 50
The MC cost changes with the change in AVC and it is independent of fixed cost. In the beginning, the MC falls, reaches its minimum and thereafter continuously rises. MC is also U-shaped. The MC curve cuts the AC and AVC curves at their minimum points.
The cost output relation during the short period can be seen from the following table:
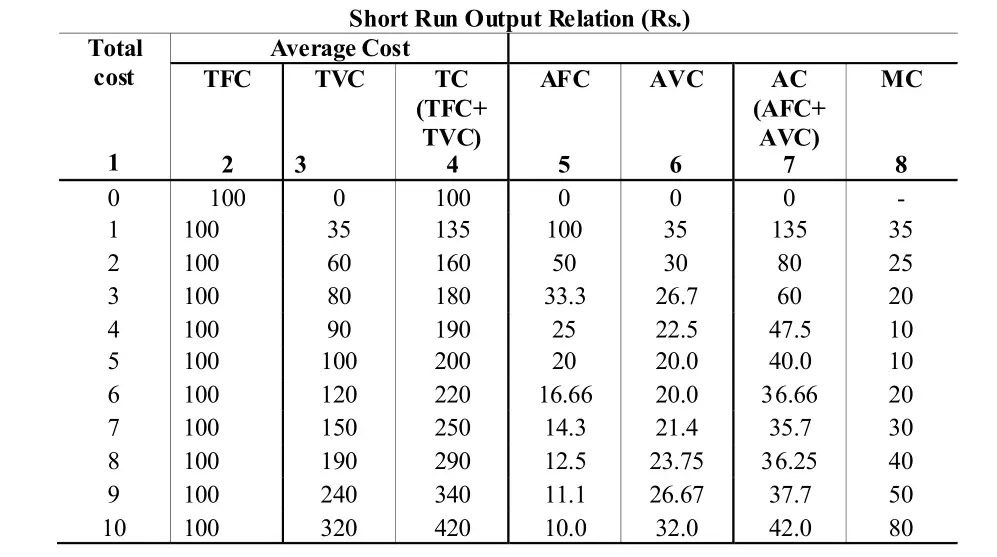
The above table reveals the trends in total costs (TFC and TVC), the average cost (AFC and AVC) and MC. TFC remains constant while TVC goes on increasing and consequently TC is also increasing. AFC is decreasing, but it is positive AVC decreases, remains constant and thereafter increases.
AC also decreases, remains constant and shows an increasing trend. MC increases remain constant and thereafter shows an increasing trend.
On the basis of table 2 we can show the costs and output relation during the short period in the following diagram:
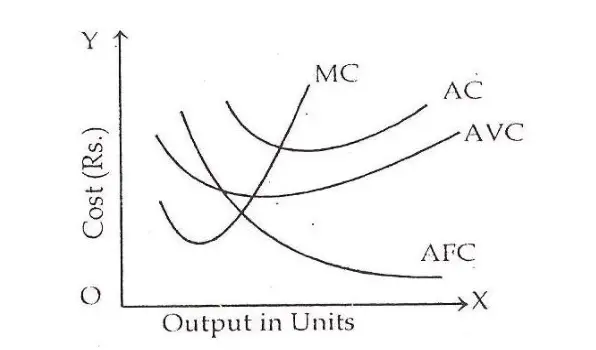
The diagram shows cost on the OY-axis and units of output on the OX-axis. AC, MC and AVC are U- Shaped curves. The U-Shaped curves are on account of the operation of the laws of returns during the short period. AFC curve shows a decreasing trend, MC curve passes through the minimum points of AC and AVC curves. There is a close relationship between AC and MC as given below:
- AC and MC fall in the beginning but MC falls more rapidly than AC and MC is below AC or AC is greater than MC (AC>MC).
- When AC rises MC also rises but is rises more rapidly than the AC and MC is greater than AC (MC>AC).
- When AC is minimum it is equal to MC. The MC curve cuts the AC curve at its minimum points.
Relationship between Average Cost and Marginal Cost
The relation between AC and MC can be seen from the following diagram during short period,
Average Cost and marginal cost are closely related, which may be explained as follows:
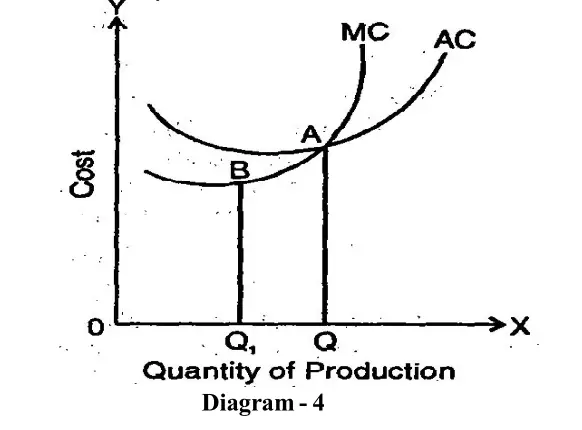
- AC and MC both are calculated on the basis of total cost of production.
- When at initial stage, AC curve falls, then MC curve falls up to a limit, but after a stage, MC curve starts rising, although AC curve goes on falling. Hence, MC is always less than average cost, in conditions of decreasing average costs.
- When AC curve is at its lowest point, then MC curve cuts AC curve from below, i.e. minimum average cost is equal to marginal cost.
- When AC curve increases, then MC curve is above AC curve and increases faster than AC curve.