Table of Contents
What is Big Data?
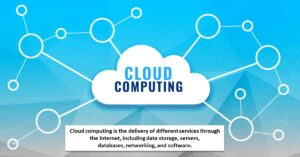
The term “Big Data” refers to the evolution and use of technologies that provide the right user at the right time with the right information from a mass of data that has been growing exponentially for a long time in our society. The challenge is not only to deal with rapidly increasing volumes of data but also the difficulty of managing increasingly heterogeneous formats as well as increasingly complex and interconnected data.
At the current pace, around 2.5 quintillion bytes of data are created each day, and the pace is increasing with the continuous evolution of the Internet of Things (IoT). This results in the generation of data sets of enormous volume and complexity called Big Data.
Such data cannot be processed and analyzed using traditional data processing tools as the data is not only voluminous but also unstructured like our posts, instant messages and chats, photographs that we share through various sites, our tweets, blog articles, news items, opinion polls and their comments, audio/video chats, etc.
Big Data not only represents voluminous data, but it also involves various challenges like integration, storage, analysis, searching, processing, transfer, querying, and visualization of such data.
Big data sometimes hold rich information and knowledge which is of high business value, and therefore there is a keen effort in developing software and methods to process and analyze big data.
Characteristics of Big Data
These are following five characteristics of big data which discussed below:
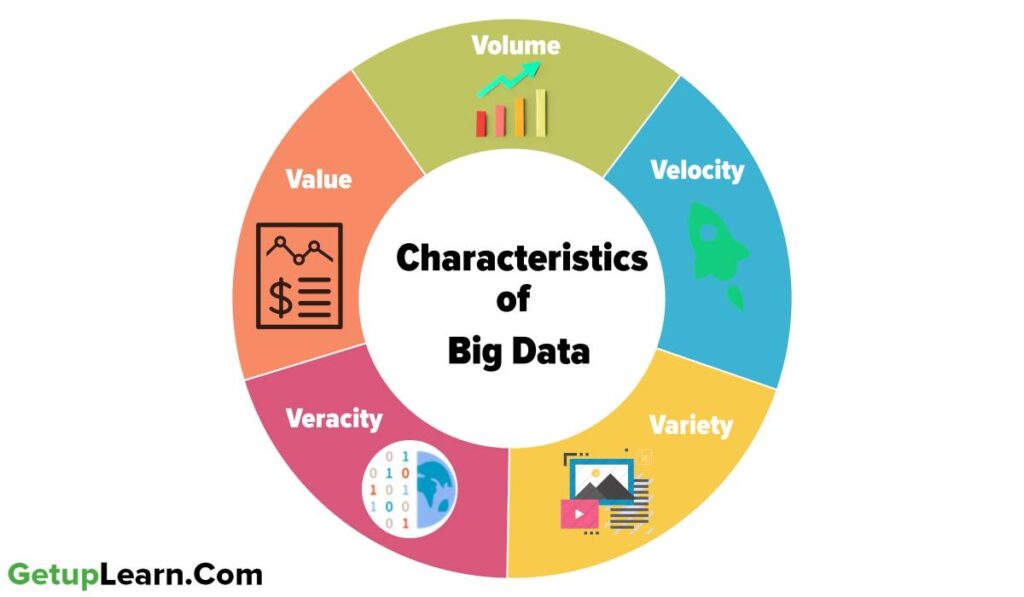
Volume
The most The exponential growth in the data storage as the data is now more than text data. The data can be found in the format of videos, music, and large images on our social media channels. It is very common to have Terabytes and Petabytes of the storage system for enterprises.
As the database grows the applications and architecture built to support the data need to be re-evaluated quite often. Sometimes the same data is re-evaluated with multiple angles and even though the original data is the same the newfound intelligence creates an explosion of the data. The big volume indeed represents Big Data.
Velocity
The data growth and social media explosion have changed how we look at the data. There was a time when we used to believe that data of yesterday is recent. As a matter of fact newspapers is still following that logic. However, news channels and radios have changed how fast we receive the news.
Today, people reply on social media to update them with the latest happening. On social media sometimes a few seconds of old messages (a tweet, status updates, etc.) is not something that interests users.
They often discard old messages and pay attention to recent updates. The data movement is now almost real-time and the update window has reduced to fractions of the seconds. This high-velocity data represent Big Data.
Variety
It asserts that Data can be stored in multiple formats. For example, database, excel, CSV, access, or as the matter of fact, it can be stored in a simple text file. Sometimes the data is not even in the traditional format as we assume, it may be in the form of video, SMS, pdf or something we might have not thought about it.
It is the need of the organization to arrange it and make it meaningful. It will be easy to do so if we have data in the same format, however it is not the case most of the time. The real world has data in many different formats and that is the challenge we need to overcome with Big Data. This variety of data represent Big Data.
Veracity
Big data can be sometimes inconsistent, biased, noisy or there can be abnormalities in the data or issues with the data collection methods. Veracity refers to the trustworthiness of the data because processing such incorrect data can give wrong results or mislead the interpretations.
Value
Big data is not only just a big pile of data but also possesses to have hidden patterns and useful knowledge which can be of high business value. But as there is a cost of investment of resources in processing big data, we should make a preliminary inquiry to see the potential of the big data in terms of value discovery or else our efforts could be in vain.
Big Data Tools
These are some big data tools mentioned below:
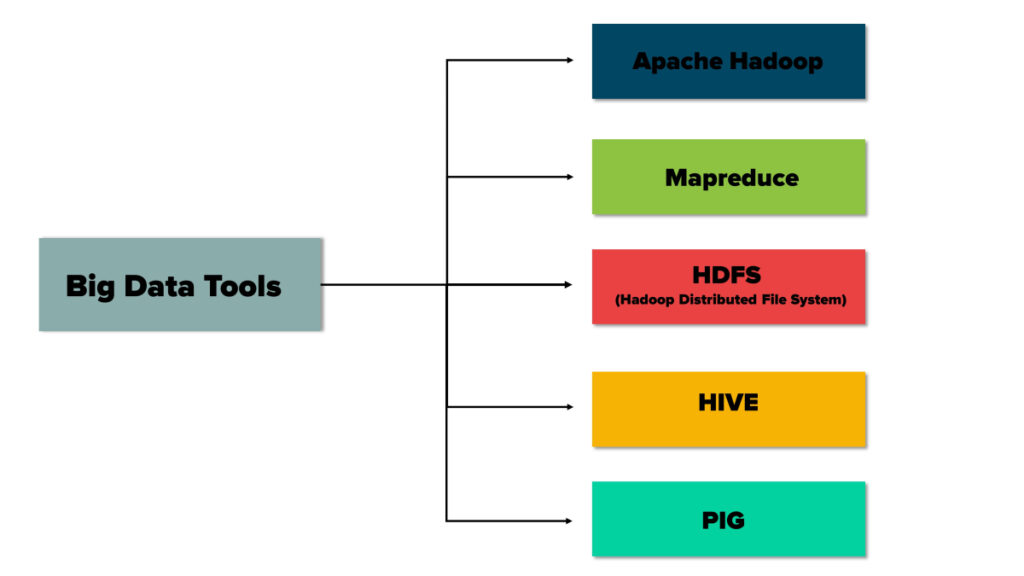
Apache Hadoop
Apache Hadoop is one of the main supportive elements in Big Data technologies. It simplifies the processing of large amounts of structured or unstructured data in a cheap manner. Hadoop is an open-source project from Apache that is continuously improving over the years.
Hadoop is basically a set of software libraries and frameworks to manage and process big amounts of data from a single server to thousands of machines. It provides an efficient and powerful error detection mechanism based on application layer rather than relying upon hardware.”
Mapreduce
MapReduce was introduced by Google to create a large amount of web search indexes. It is basically a framework to write applications that processes a large amount of structured or unstructured data over the web. MapReduce takes the query and breaks it into parts to run it on multiple nodes.
By distributed query processing it makes it easy to maintain a large amount of data by dividing the data into several different machines.
Hadoop MapReduce is a software framework for easily writing applications to manage large amounts of data sets in a highly fault-tolerant manner. More tutorials and getting started guides can be found at Apache Documentation.
HDFS (Hadoop Distributed File System)
HDFS is a java based file system that is used to store structured or unstructured data over large clusters of distributed servers. The data stored in HDFS has no restriction or rule to be applied, the data can be either fully unstructured or purely structured. In HDFS the work to make data useful is done by the developer’s code only.
Hadoop distributed file system provides a highly fault-tolerant atmosphere with deployment on low-cost hardware machines. HDFS is now a part of Apache Hadoop project, more information and installation guide can be found at Apache HDFS documentation.
HIVE
Hive was originally developed by Facebook, now it is made open source for some time. Hive works something like a bridge in between sql and Hadoop, it is basically used to make Sql queries on Hadoop clusters. Apache Hive is basically a data warehouse that provides ad-hoc queries, data summarization and analysis of huge data sets stored in Hadoop compatible file systems.
Hive provides a SQL like called HiveQL query based implementation of huge amount of data stored in Hadoop clusters. In January 2013 apache releases Hive 0.10.0, more information and installation guide can be found at Apache Hive Documentation.
PIG
Pig was introduced by yahoo and later on, it was made fully open source. It also provides a bridge to query data over Hadoop clusters but unlike hive, it implements a script implementation to make Hadoop data access able by developers and business persons. Apache pig provides a high-level programming platform for developers to process and analyses Big Data using user-defined functions and programming efforts.
In January 2013 Apache released Pig 0.10.1 which is defined for use with Hadoop 0.10.1 or later releases. More information and an installation guide can be found at Apache Pig Getting Started Documentation.
Types of Big Data Analytics
These are types of big data analytics mentioned below:
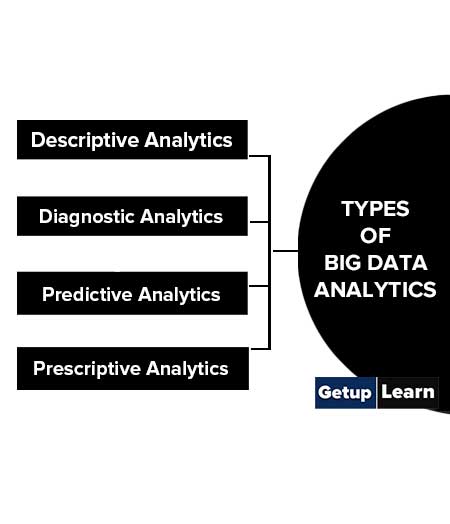
Descriptive Analytics
It consists of asking the question: What is happening? It is a preliminary stage of data processing that creates a set of historical data. Data mining methods organize data and help uncover patterns that offer insight. Descriptive analytics provides future probabilities and trends and gives an idea about what might happen in the future.
Diagnostic Analytics
It consists of asking the question: Why did it happen? Diagnostic analytics looks for the root cause of a problem. It is used to determine why something happened. This type attempts to find and understand the causes of events and behaviors.
Predictive Analytics
It consists of asking the question: What is likely to happen? It uses past data in order to predict the future. It is all about forecasting. Predictive analytics uses many techniques like data mining and artificial intelligence to analyze current data and make scenarios of what might happen.
Prescriptive Analytics
It consists of asking the question: What should be done? It is dedicated to finding the right action to be taken. Descriptive analytics provides historical data, and predictive analytics helps forecast what might happen. Prescriptive analytics uses these parameters to find the best solution.
Internet of Things (IOT)
The ‘Internet of Things is a network of devices that have embedded hardware and software to communicate (connect and exchange data) with other devices on the same network as shown in Figure 3.10. At present, in a typical household, many devices have advanced hardware (microcontrollers) and software.
These devices are used in isolation from each other, with a maximum human intervention needed for operational directions and input data. IoT tends to bring together these devices to work in collaboration and assist each other in creating an intelligent network of things.
For example, if a microwave oven, an air conditioner, door lock, CCTV camera, or other such devices are enabled to connect to the Internet, we can access and remotely control them on the go using our smartphone.
Web of Things (WoT)
Internet of Things allows us to interact with different devices through the Internet with the help of smartphones or computers, thus creating a personal network. But to interact with ‘n’ number of different devices, we need to install ‘n’ different apps. Wouldn’t it be convenient to have one interface to connect all the devices? The web is already being used as a system to communicate with each other.
So, will it be possible to use the web in such a way that all things can communicate with each other in the most efficient manner by integrating them together? Web of Things (WoT) allows the use of web services to connect anything in the physical world, besides human identities on the web.
It will pave way for creating smart homes, smart offices, smart cities, and so on.
Sensors
What happens when you hold your mobile vertically or horizontally? The display also changes to vertical or horizontal with respect to the way we hold our mobile. This is possible with the help of two sensors, namely accelerometer, and gyroscope (gyro).
The accelerometer sensor in mobile phones detects the orientation of the phone.
The Gyroscope sensors track the rotation or twist of your hand and add to the information supplied by the accelerometer. Sensors are very commonly used for monitoring and observing elements in real-world applications.
The evolution of smart electronic sensors is contributing in a large way to the evolution of IoT. It will lead to the creation of new sensor-based, intelligent systems.
A smart sensor is a device that takes input from the physical environment and uses built-in computing resources to perform predefined functions upon detection of specific input and then process data before passing it on.
Smart Cities
With rapid urbanization, the load on our cities are increasing day-by-day, and there are challenges in the management of resources like land water, waste, air pollution, health and sanitation, traffic congestions, public safety, and security, besides the overall city infrastructures including road, rail, bridge, electricity, subways, disaster management, sports facilities, etc.
These challenges are forcing many city planners around the world to look for smarter ways to manage them and make cities sustainable and livable. The idea of a smart city makes use of computer and communication technology along with IOT to manage and distribute resources efficiently.
FAQ About Big Data
What are the 5 characteristics of big data?
These are the following five characteristics of big data: 1.Volume, 2.Velocity, 3.Variety, 4.Veracity, 5.Value.
What is meant by big data?
The term “Big Data” refers to the evolution and use of technologies that provide the right user at the right time with the right information from a mass of data that has been growing exponentially for a long time in our society.
Big data: a revolution that will transform how we live, work, and think.
Big Data presents itself as a solution designed to provide everyone real-time access to giant databases. Big Data is a very difficult concept to define precisely since the very notion of big in terms of volume of data varies from one area to another.
How is big data collected?
At the current pace, around 2.5 quintillion bytes of data are created each day, and the pace is increasing with the continuous evolution of the Internet of Things (IoT). This results in the generation of data sets of enormous volume and complexity called Big Data.
What are the 4 types of big data analytics?
These are types of big data analytics: Descriptive Analytics, Diagnostic Analytics, Predictive Analytics, Prescriptive Analytics.